Explore the potential of Islamic ETFs and Depositary Receipts in attracting foreign investment, creating investment products, and addressing challenges and opportunities in the market. Learn about ETF trading, market cap trends, and the advantages of investing in ETFs. Understand the selection methods for ETF underlying baskets and how they impact transparency and efficiency.
Please find below an Image/Link to download the presentation.
The content on the website is provided AS IS for your information and personal use only. It may not be sold, licensed, or shared on other websites without obtaining consent from the author. If you encounter any issues during the download, it is possible that the publisher has removed the file from their server.
You are allowed to download the files provided on this website for personal or commercial use, subject to the condition that they are used lawfully. All files are the property of their respective owners.
The content on the website is provided AS IS for your information and personal use only. It may not be sold, licensed, or shared on other websites without obtaining consent from the author.
E N D
Presentation Transcript
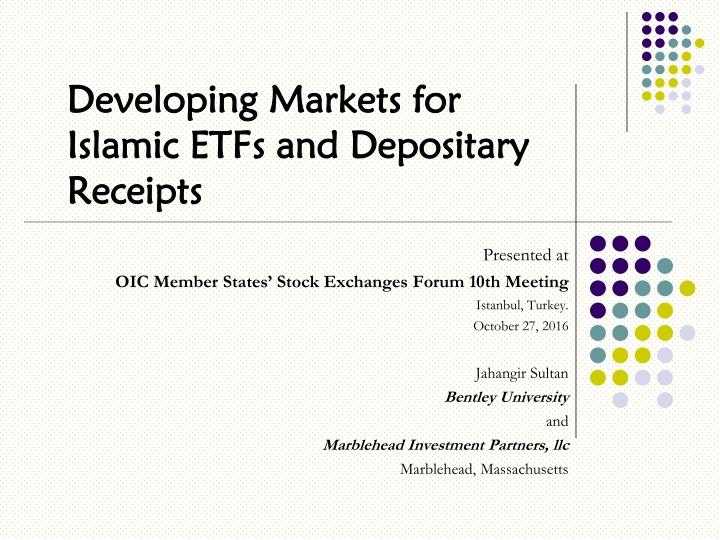
Developing Markets for Developing Markets for Islamic ETFs and Depositary Islamic ETFs and Depositary Receipts Receipts Presented at OIC Member States Stock Exchanges Forum 10th Meeting Istanbul, Turkey. October 27, 2016 Jahangir Sultan Bentley University and Marblehead Investment Partners, llc Marblehead, Massachusetts
Promoting Islamic Investment Products Attract foreign investment increased product development Macro investing Creating ETFs representing an index Micro investing Investing in firm-specific DRs Challenges and opportunities
ETFs Open ended mutual funds that trade like stocks ETFs represent stocks, bonds, currencies, country index, commodities, gold, etc. Some are passive (indexed) while others are active -- smart beta ETFs Transparency: NAV of underlying basket of shares reported daily
Why invest in ETFs Participate in the full index Portfolio management style (factor investing); style consistency Being able to trade anytime when the stock market is open Low costs because of lower management fees Potential for diversification 6
ETF underlying basket selection Physical -- Full replication of the index (identical replica) Buy shares that are included in the index with the same weightings Most transparent; Low tracking error; too many stocks to buy; Not very efficient (costly)
ETF underlying basket selection Physical Stratified Sampling Buy shares of largest index members (liquid stocks). Buy reduced number of smaller companies that mimic the index. Rebalancing is easy; Tracking errors might be higher; Not very transparent
ETFs- alternative weighting Selections Rules based quantitatively optimized Instead of cap weighting Factor based Factors could be fundamental/economic factors firm-specific
Core and satellite approach Sector Global Style Core ETF Multi factor Derivatives Core is a diversified strategy based on an index Satellite are different tilts (opportunistic) to add exposure and enhance returns
Islamic and Conventional ETFs: Differences Islamic ETFs include SC stocks Benchmark index is SC Diversification benefits are lower with Islamic ETFs because many sectors/stocks are excluded Risk is lower Excludes derivatives Risk management of ETFs is very limited Does not allow securities lending, shorting, or swaps
Size of Islamic ETF Industry and performance Shariah-compliant equity ETFs listed globally in 10 countries, including Malaysia, Saudi Arabia and Turkey added up to $1.23 billion (Global Finance, July 2014) Alam (2013) finds Islamic ETF outperformed conventional ETFs (2008- 2011) small sample Lackluster performance in other cases 13
Islamic ETF providers --perspectives Perspectives on growth ETFs issued from Western economies Slow growth ETFs issued from Eastern economies Slow growth; Demand side Supply side Performance
Slow Growth of Islamic ETFs exposure Developed country ETFs have less than 1% exposure to Islamic countries. Islamic countries are not well represented in Sharia compliant universe of stocks (ISWD MSCI world exposure is about 94% (US and developed economies) Does not really promote developing /emerging countries capital markets in these countries remain illiquid
Why slow Growth of Islamic ETFs Most faith based ETFs are experiencing slow growth Not just Islamic ETFs Some Islamic ETFs have closed after a brief period of existence Christian ETFs are also having similar issues Compared to that SRI/ESG/Gender/Environment issues are doing better
Slow Growth of Islamic ETFs track record Islamic ETF providers may not have the track record. Javelin (JVS) had no previous experience in managing a fund
Slow Growth of Islamic ETFs identity crisis Low favorability of faith based investment products in general Negative perception of Islam and Sharia in the West. Unfamiliarity with Islamic ETFs among investors - Not on the radar screens of investment advisors
Slow Growth of Islamic ETFs performance By definition, Islamic ETFs may not outperform the underlying index Often less than full replication Remaining basket not representative of the index Further reduction in coverage due to Sharia screening of negative stocks So, are we expecting a lot?
Slow Growth of Islamic ETFs illiquidity Low trading volume of underlying shares High bid-ask spread Difficult to exit with fair prices Creation and redemption help -- but tough to unload large number of shares (Mahdzir Othman, i-VCAP)
Slow Growth of Islamic ETFs cash drag and timing issues Cash Drag: When dividends are distributed by underlying shares, distribute to ETFs on a real time basis. Should reduce cash drag and tracking error Timing: If index reconstitutes, the rebalancing of the ETF should be done quickly to reduce tracking error.
Slow Growth of Islamic ETFs short selling Since, trading alternatives such as short selling is not available in Islamic ETFs, they tend to be less attractive for non-Muslim individuals or institutional investors with mandates for risk management For Muslim investors, this is not an issue
Islamic ETFs: lack of product diversity Islamic ETFs have a single focus Sharia compliant large/mid-cap stocks Not enough attention to SRI/ESG/governance themes Raja Teh Maimunah, head of Islamic markets at Bursa Malaysia --the lack of diversified products was one shortcoming of the industry compared to its conventional peers.
Slow Growth of Islamic ETFs support system Since these ETFs have low trading volume, they have trouble exciting market makers Unlike mutual funds (with dedicated distribution agents), dealers and agents of ETFs do not charge commission. ETF providers can only charge very low management fees. (Mahdzir)
Problems with Islamic ETFs- government support Should governments support Islamic ETFs? Why should government be involved in helping out Islamic ETFs when non-Sharia ETFs are left to fend for themselves Governments should create a fair and consistent standards for all. UK FSA no obstacle, no special favors level playing field.. Financial regulator, not a religious regulator
Problems with Islamic ETFs- government support There is a role for sovereign wealth funds for supporting Islamic ETFs issued in their country. But sovereigns buying Western economies-based ETFs does not benefit the industry or the constituents which are from Islamic countries. If IslamicETFs are going to take hold globally and specifically in the Middle East, there has to be government, or quasi-government support, through sovereign wealth fund participation in the market (Source : Islamic Finance Asia)
Soft support Rebranding? Controversial but may be prudent Improve image of Islam in Western economies How? Investor education; roadshows in Islamic and Western economies connecting with Islamic centers in large cities to highlight benefits of Islamic ETFs Providing research and training support; webinars; educational seminars
Conclusions Islamic ETFs investors do not have to sacrifice returns for subscribing to faith Islamic ETFs should be attractive to non-Muslim investors for their performance. Overly aggressive optimization should be avoided to reduce tracking error Investor familiarity with ETFs should be improved SECs should set up uniform standards for issuing ETFs
Depositary Receipt (DR) A stock that trades in the domestic stock exchange but represents a specific number of shares in a foreign stock Traded like stocks Issued/sponsored by a domestic bank or brokerage
Mechanics of Depositary Receipts (DRs) Depositary Receipts issued by a bank representing underlying shares held by a custodial bank Receipts (DRs) Shares Receipts for shares listed on home exchange Publicly traded foreign firms Traded by home investors Shares traded on foreign stock exchange Shares Arbitrage Activity 31
Three Types of DRs Level 1: Foreign companies either don't qualify for listing on an exchange OTC; loosest requirements from the SEC Level 2: Listed on an exchange or quoted on Nasdaq Filing requirements; higher visibility trading volume Level 3: Capital raising; high quality
Sponsored vs Unsponsored DRs Sponsored Supply driven Deutsche creates a DR on behalf of a foreign company for a fee Represents legal relationship between Deutsche and the foreign company Trade on NYSE/NASDAQ; full voting rights Unsponsored Demand driven Trade on OTC; no voting rights 33
Risks of DRs Political Risk Is the government of the DR s home country stable? Exchange Rate Risk Is the currency of the home country stable? Inflationary Risk Extension of exchange rate risk
Marketing DRs --Listing Most often cited reasons for listing DRs Reducing the stake held by existing shareholders Improving liquidity and broadening the shareholder base Capitalizing on the product market reputation Fees Lowering cost of capital External image Promote price discovery 35
Investors benefits from DRs For individuals, DRs are an easy, cost-effective way to buy shares in a foreign company Country exposure Foreign exchange exposure Firm-specific exposure Investing in industries that are absent in home country Non-systematic risk should be higher International diversification would be greater
Who are the Investors in DRS? Institutional investors dominate the DR market, accounting for 72% of all holdings. They possess significant advantage in accessing, acquiring, processing information. A significant part of this pool is involved in high frequency trading and quantitative portfolio optimization. 37
Islamic DRs Select DRs by applying Sharia screening Restricted universe because of negative screens Apply the DJIM index as a benchmark Single stock DRs Allow faith based investing and foreign diversification 38
The universe of DRs in this study S&P Dow Jones Islamic S&P Dow Jones Global S&P Dow Jones SRI (Socially responsible DRs and ESG) Passive min-variance optimization Performance indicator Sharpe, MSR, Sortino Constituents provided by S&P Dow Jones 39
International portfolio diversification Islamic DRs or their underlying stocks Compare international portfolio diversification with DRs and their underlying foreign stocks which is better? Four regimes 2003-2014 Pre-crash (2003-Feb 2007) Crash (2007 (March) 2009 (April) Recovery (2009 (May) 2014 October)
Performance* of Islamic DRs Regimes DR portfolio rank 1 2 2 1 2003-2014 Pre-crisis Crisis Post-crisis *Based on risk adjusted returns * Underlying portfolios perform similar
The Universe DR Universe Category 144A LEVEL I Sponsored Unsponsored LEVEL II GLOBAL ISLAMIC SRI 3 46 39 7 12 Grand Total 3 238 169 69 63 110 66 44 21 82 64 18 30 LEVEL III 20 12 16 48 Grand Total 151 124 77 352 Underlying Stocks* 124 151 77 352 Each DR was matched by its corresponding underlying stock 42
Diversification with DRs and underlying stocks (2003-2014 (October) DR Portfolio Number of stocks MSR Ranking Category Return Risk Tracking Error MSR Downside risk Excess Return Sortino Islamic DR 7.31% 11.64% 1.83% 20 32.92% 1.29% 0.02% 0.02 1 Global DR 6.18% 10.70% 2.03% 27 25.21% 1.43% 0.00% 0.00 2 SRI DR 6.18% 15.27% 1.63% 23 17.67% 1.18% 0.00% 0.00 3 Underlying Stock Portfolio Islamic Stocks 7.43% 11.90% 1.92% 20 33.16% 1.36% 0.02% 0.02 3 Global Stocks 9.41% 10.81% 2.04% 27 54.86% 1.40% 0.06% 0.04 1 SRI Stock 9.97% 15.50% 1.73% 23 41.87% 1.20% 0.07% 0.06 2 43
Diversification with DRs and underlying stocks: Pre-crisis (2003-2007 (Feb)) DR Portfolio Number of stocks MSR Ranking Return Risk Tracking Error MSR Downside risk Excess Return Sortino Category Islamic DR 12.84% 9.57% 1.40% 20 88.29% 1.01% 0.03% 0.03 2 Global DR 11.70% 10.03% 1.51% 27 72.89% 1.06% 0.01% 0.01 3 SRI DR 17.08% 11.67% 1.43% 23 108.81% 0.97% 0.11% 0.11 1 Underlying Stock Portfolio Islamic Stocks 13.07% 9.48% 1.44% 20 91.62% 1.02% 0.03% 0.03 3 Global Stocks 14.58% 9.96% 1.53% 27 102.37% 1.04% 0.06% 0.06 2 SRI Stock 20.22% 11.77% 1.54% 23 134.49% 1.02% 0.17% 0.17 1 44
Diversification with DRs and underlying stocks: Crisis (2007 (Mar)-2009 (Apr) DR Portfolio Number of stocks MSR Ranking Category Return Risk Tracking Error MSR Downside risk Excess Return Sortino Islamic DR -12.04% 17.26% 2.70% 20 -2.71% 1.88% 0.22% 0.12 2 Global DR -5.58% 15.20% 3.04% 27 -1.41% 2.00% 0.35% 0.17 1 SRI DR -18.20% 24.23% 2.30% 23 -5.30% 1.66% 0.11% 0.06 3 Underlying Stock Portfolio Islamic Stocks -11.67% 18.08% 2.89% 20 -2.77% 2.02% 0.23% 0.11 2 Global Stocks -2.74% 15.52% 3.08% 27 -0.99% 2.03% 0.40% 0.20 1 SRI Stock -13.27% 25.10% 2.46% 23 -4.25% 1.70% 0.20% 0.12 3 45
Diversification with DRs and underlying stocks: Post-Crisis (2009 (May)-2014 (October) DR Portfolio Number of stocks MSR Ranking Category Return Risk Tracking Error MSR Downside risk Excess Return Sortino Islamic DR 10.88% 10.07% 1.67% 20 81.62% 1.19% -0.06% -0.05 1 Global DR 6.72% 8.84% 1.85% 27 46.00% 1.40% -0.14% -0.10 2 SRI DR 7.70% 12.69% 1.44% 23 39.78% 1.08% -0.12% -0.12 3 Underlying Stock Portfolio Islamic Stocks 10.80% 10.23% 1.74% 20 79.62% 1.25% -0.06% -0.05 2 Global Stocks 10.36% 8.94% 1.84% 27 86.20% 1.34% -0.07% -0.05 1 SRI Stock 11.53% 12.57% 1.50% 23 70.59% 1.08% -0.05% -0.05 3 46
Diversification with DRs DR and UL portfolio returns are very similar --no statistical differences in the returns Directional diversification strategy (DR to UL or UL to DR) yield similar results Indication of maturity of the markets especially for cross-listed stocks Stocks with DRs perform similar important feed back effects -- 47
Diversification with DRs Islamic DR portfolio has the best performance for post-recovery period Islamic UL portfolio performs very similar During financial crisis, Islamic portfolios were effective in preserving value not as effective as global portfolio SRI portfolio had the worst performance during the crisis 48
Depositary Concerns Poor liquidity-DRs and underlying Large cancellation reduces business; cancellation/conversion fees discourage flow How to encourage investors to stay engaged with DRs The effects of corporate actions on trading volume Sanctity of financial statements Do brokers understand risks?
Broker Concerns Poor liquidity-DRs and underlying Market price; execution delays Cancellation/conversion fees discourage flow Inventory -- Books open? Cross-border settlement delay; infrastructure The effects of corporate actions on trading volume Sanctity of financial statements


")