Masking the Underlying Number of People with HIV in England
England has achieved the 95-95-95 UNAIDS targets in 2019 and 2020, with a focus on understanding the distribution of people living with HIV to enhance prevention activities. This case study delves into the methods used to estimate HIV prevalence, diagnose cases, and ensure viral suppression, shedding light on the challenges and successes in meeting the targets.
Download Presentation

Please find below an Image/Link to download the presentation.
The content on the website is provided AS IS for your information and personal use only. It may not be sold, licensed, or shared on other websites without obtaining consent from the author.If you encounter any issues during the download, it is possible that the publisher has removed the file from their server.
You are allowed to download the files provided on this website for personal or commercial use, subject to the condition that they are used lawfully. All files are the property of their respective owners.
The content on the website is provided AS IS for your information and personal use only. It may not be sold, licensed, or shared on other websites without obtaining consent from the author.
E N D
Presentation Transcript
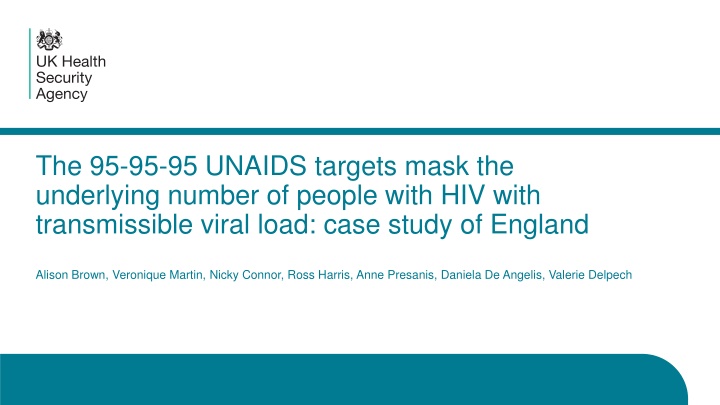
The 95-95-95 UNAIDS targets mask the underlying number of people with HIV with transmissible viral load: case study of England Alison Brown, Veronique Martin, Nicky Connor, Ross Harris, Anne Presanis, Daniela De Angelis, Valerie Delpech
England has met the 95-95-95 targets in 2019 and 2020 Aims: Assumptions behind the 95-95-95 model Percentages mask number of people with transmissible virus Use 95-95-95 model as tool to show distribution of people living with transmissible virus to inform prevention activities. 95-95-95 outcomes in England, 2018- 2020* 100% 90% 80% 70% 60% 97% 97% 97% 50% 98% 98% 99% 40% 93% 94% 95%, (93-96%) (90-95%) (92-96%) 30% 20% 10% 0% 2018 (n=94850) 2019 (n=96190) 2020 (n=97740) Diagnosed Receiving ART Virally suppressed *Proportion diagnosed is an estimate and presented with 95% credible intervals. 2
Methods - England Data source Comprehensive data on HIV diagnosis and every subsequent patient attendance (HARS), and HIV testing data through GUMCAD (sexual health services) HARS Method Estimated prevalence of diagnosed and undiagnosed HIV prevalence through MPES* method. Attributes Given as 95% credible interval range Assumptions Median value is taken. Model assumptions. Number living with HIV Number diagnosed Those seen for care Comprehensive Misses those lost to follow up and those not linked to care Number on ART HARS Those reported to be receiving treatment or VL<200 if ART data missing Those with VL <200 copies Comprehensive Number virally suppressed HARS Complete for about 80% of records Those with missing information have same rate of VS as those without 3
Comparison of standard and revised method: 2020* treatment and no viral load for two years +7350 120000 not in -4800 on care 100000 80000 60000 95% 100% 95% 100% (93-96%) 99% 92% 97% (93-96%) 92% 40000 20000 0 Standard method Revised method All people living with HIV *Number living with HIV and proportion diagnosed are estimates and presented with 95% credible intervals. Number with diagnosed HIV Number on ART Number virally suppressed 4
Estimated number of people with transmissible levels of HIV: England, 2020 Counterfactual scenarios Number people with transmissible virus % of people with HIV with transmissib le virus 20000 Missing VL: missing for two previous years assumed not VS 18000 22% Missing VL: assumed proportion VS same as where data reported Treated with unsuppressed viral load 16000 2% 14000 9% Median (95%CR estimate of undiagnosed infection) 19800 (18,880- 22,100) 15,400 20% (20- 22%) 6% 12000 Not on treatment 10000 Missing VL: assumed proportion VS same as where data reported 16% 35% 8000 Not accessing care (95% CrI 3,640 6,980) 6000 1% Not linked to care 4000 Missing VL: missing for two previous year assumed no virally suppressed 19,800 20% 24% 2000 Undiagnosed 0 Transmissible viral load 5
Estimated number of people with transmissible viral load by demographic and exposure group, England 2020 PWID All female heterosexuals Exposure All male heterosexuals Non-Black African heterosexuals Black African heterosexuals GBMSM residen Area of Rest of England ce London 60+ Age group 45-59 35-44 15-34 0% 10% 20% 30% 40% 50% 60% 70% 80% 90% 100% Undiagnosed Not in care Not on treatment Not virally suppressed On treatment VL not reported 6
Limitations Estimating the undiagnosed population size will always have inherent uncertainty The number of people lost to follow up in 2020 is twice as high as in previous years. Due to changes in prescribing due to COVID-19, some still be virally suppressed Data on those leaving England unavailable but follow up undertaken 7
Conclusion Standard method for calculating the 95-95-95 metric excludes those lost to follow up. The metric masks true number of people with transmissible viral load. In England, where the official estimates are 95-99-97, around 19,800 (15,000- 22,000) people may have transmissible virus, equivalent to 20% (15-22%) of all people with HIV Calculating transmissible virus using the 95-95-95 model allows us to identify where to focus prevention efforts. Presentation title 8
