Massachusetts Solar Market Policy Design
Designing a cleaner energy future for the Commonwealth of Massachusetts through the Solar Carve-Out II policy, focusing on solar market growth, installations, and key features of the SREC-II program. The policy aims to maintain and expand PV installations, control ratepayer costs, manage market growth, ensure competitive diversity among PV developers, and address financing barriers for residential and non-profit ownership models.
Download Presentation

Please find below an Image/Link to download the presentation.
The content on the website is provided AS IS for your information and personal use only. It may not be sold, licensed, or shared on other websites without obtaining consent from the author.If you encounter any issues during the download, it is possible that the publisher has removed the file from their server.
You are allowed to download the files provided on this website for personal or commercial use, subject to the condition that they are used lawfully. All files are the property of their respective owners.
The content on the website is provided AS IS for your information and personal use only. It may not be sold, licensed, or shared on other websites without obtaining consent from the author.
E N D
Presentation Transcript
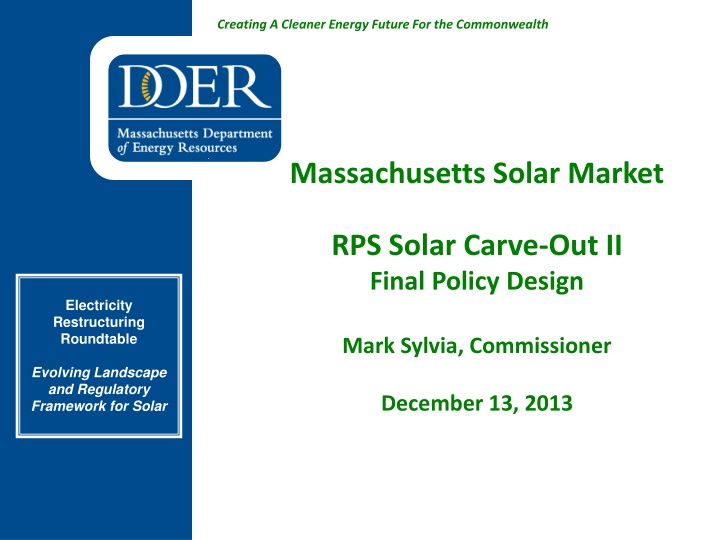
Creating A Cleaner Energy Future For the Commonwealth Massachusetts Solar Market RPS Solar Carve-Out II Final Policy Design Electricity Restructuring Roundtable Mark Sylvia, Commissioner Evolving Landscape and Regulatory Framework for Solar December 13, 2013
Remarkable Solar Growth in Mass. Creating A Cleaner Energy Future For the Commonwealth
Current/Projected Market Installations 1800 250 Cumulative Installed Capacity Solar Market Installation Activity 1600 Annual Installations, MW 200 Cumulative Installations, MW 1400 Current 400 MW Program (2013-2014 estimate) 1200 150 1000 800 100 Post-400 MW Program 600 400 50 200 0 0 2010 2011 2012 2013 2014 2015 2016 2017 2018 2019 2020 2021 2022 To meet Governor s 1600 MW goal, market needs to install 140- 200 MW per year between 2014 and 2020 (adjusted for final SREC-I Capacity) This installation rate maintains growth from 2012 installation rate, but does not sustain the accelerated market growth experienced in 2013. 3 Creating A Cleaner Energy Future For the Commonwealth
SREC-II Policy Objectives Provide economic support and market conditions to maintain and expand PV installations in MA Control ratepayer costs Maintain robust, progressive growth across installation sectors and manage growth to reach 1600 MW by 2020 Maintain competitive market of diverse PV developers, without undue burdens of entry Address financing barriers limiting residential and non-profit direct ownership, without compromising third-party ownership model Minimize regulatory complexity and maintain flexibilities to respond to changing conditions 4 Creating A Cleaner Energy Future For the Commonwealth
SREC-II: Key Design Features Program Cap of 1600 MW minus the capacity reached in SREC-I by June 30, 2014. Projects eligible to generate SREC-IIs for 10 years (40 quarters), with incentive declining over time through a 10-year forward schedule of Auction Prices and ACP Rates. Units generate Class I RECs following 10 years of eligibility. SREC Factors provide financial incentive differentiated between market sectors. Review of SREC Factors 2016/2017 provides ratepayer and developer protections. Forward Minting is eliminated. Residential direct-ownership market will be addressed with an ACP-funded financing program. Managed Growth sector provided fixed SREC Factor and will not be subject to competitive solicitations. Qualifications will be limited by Annual Blocks made available on a two year forward schedule by DOER. Compliance Obligation and Minimum Standard set in regulation for 2014 and 2015. Annual calculations thereafter based on actual and projected supply, constrained by Cumulative Installed Capacity Targets, which informs determination of next Annual Block for Managed Growth sector. 5 Creating A Cleaner Energy Future For the Commonwealth
Reducing Incentive Value Over Time $/MWh Auction Price After 5% Fee 285 285 285 271 257 244 232 221 210 199 189 Auction Price Bid Auction Price and ACP Rate Schedules Year ACP Rate 2014 2015 2016 2017 2018 2019 2020 2021 2022 2023 2024 2025 2026 2027 2028 2029 2030 300 300 300 285 271 257 244 232 221 210 199 375 375 350 350 350 333 316 300 285 271 257 No change from prior Stakeholder Meetings Values are included in regulation Values announced by DOER each year to maintain 10-year forward schedule. 6 Creating A Cleaner Energy Future For the Commonwealth
Market Sectors and SREC Factors (Factors Provided in Guideline) SREC Factor for Residential increased to 1.0. Market Sector SREC Factor Residential, Parking Canopy, Emergency Power Generation, Community Shared Solar, or any Unit with a capacity <= 25 kW. A 1.0 Managed Growth has fixed SREC Factor (not subject to competition). Building Mounted, or ground mounted Unit with a capacity > 25 kW with 67% or more of the electric output on an annual basis used by an on-site load. Landfill or Brownfield, or a Unit with a capacity of <= 500 kW with less than 67% of the electrical output on an annual basis used by an on-site load. B 0.9 SREC Factors subject to evaluation in 2016/2017, to accommodate market/policy changes. Changes applied with delay. C 0.8 Managed Growth Unit that does not meet the criteria of Market Sector A, B, or C. 0.7 7 Creating A Cleaner Energy Future For the Commonwealth
Projection of Market Sector Growth 1400 Cumulative Installations DOER anticipates Managed Growth Blocks will support significant market share. Managed Growth 1200 Market Sector C Iinstalled PV, MW 1000 Market Sector B Other Market Sectors will impinge on available Blocks depending on actual growth. Market Sector A 800 600 SREC-II generation will peak in 2020/2021, and then begin to taper to zero by 2030/2031, as 10-year eligibilities expire. 400 200 0 2014 2015 2016 2017 2018 2019 2020 2021 This projection represents one sample future outcome. While these data reflect DOER s analysis of market trends, DOER does not endorse or suggest this to be the most likely outcome. 8 Creating A Cleaner Energy Future For the Commonwealth
Residential Direct Ownership ACP-funded Support Program Elimination of Forward Minting: Questions raised about FM effectiveness in achieving objective to facilitate residential financing. DOER assessed significant administrative complexities. DOER estimates that a robust residential direct ownership market would need to be supported by $20-50 million in loans annually at the start of the program, and $300-600 million cumulatively through 2020. This volume represents a significant opportunity for the financing/banking industry. DOER plans to announce, in parallel with the SREC-II rulemaking, a financing support program using ACP funds. Final development of the program will be done in coordination with stakeholder input, including direct discussions with the banking industry. DOER anticipates using approximately $30 million of ACP funds for this purpose. Leveraging funds will be important, along with strategies to enable banking sector to sustain lending as ACP support is diminished. MassCEC will maintain CommSolar II rebate program through the development of the financing program. 9 Creating A Cleaner Energy Future For the Commonwealth
Benefits and Costs of SREC-II Over program life, benefits to the electric system and public outweigh program costs. Actual SREC-II prices may be lower than Auction price, reducing program costs further. Over program life, utility rate impact of program averages 1.2% and 1.5% of total bill, with peak impact of 2.5% to 3.5% (2018-2021 timeframe). For a typical residential monthly bill, impact is $0.91 to $1.48 over program life, and $2.44 to $3.49 at peak. SREC-II brings solar into the market at incentive values 30-50 percent below SREC-I. From DOER consultants report, Task 3b: Analysis of Economic Costs and Benefits of Solar Program 10 Creating A Cleaner Energy Future For the Commonwealth
SREC-II and Net Metering Most non-residential solar projects depend on the net metering credit incentive, along with SREC revenue MA market is non-uniform in the availability and value of Net Metering credits by utility territory DOER is cognizant of Net Metering caps being reached and impact on solar (and other renewables) economic feasibility DOER currently has no policy stance on the raising of the NM caps DOER has commissioned a study on NM policy and is evaluating cost/benefits and policy options to assist policy making. Study should be available at the end of 2013 11 Creating A Cleaner Energy Future For the Commonwealth
SREC-II Anticipated Rulemaking Process RPS Class I regulation revisions for SREC-II are expected be filed any day Rulemaking will include Public Hearing and comment period in January, followed by review by Joint Committee on TUE DOER projects rule to be promulgated before the end of Q1 2014 12 Creating A Cleaner Energy Future For the Commonwealth
Solar is Working for the Commonwealth Residential solar PV prices dropped 28 percent in Massachusetts in 2012 second biggest drop in the nation last year. Governor s goal of installing 250 MW by 2017 met four years early; new goal of 1600 MW by 2020. Solar is well distributed throughout the Commonwealth, with installations in 346 of 351 MA cities and towns. Over 120 municipalities are hosting solar projects on town facilities. Solarize Mass program has supported 9 MW of residential solar in 33 towns (another 15 towns are underway). Massachusetts is well ranked nationally (SEIA 2012) 6th in solar capacity installed in 2012 7th in cumulative installed capacity 3rd in commercial installations; 6th in residential installations 2nd lowest weighted average commercial installation costs 4th in total solar jobs; 8th in per capita solar jobs Over 1800 firms in MA work primarily in the renewable energy sector, employing over 21,000 workers. Nearly 60% of renewable energy workers support the solar sector (2013 MassCEC Jobs Report). 13 Creating A Cleaner Energy Future For the Commonwealth
Thank you! Mark Sylvia Commissioner Massachusetts Department of Energy Resources 100 Cambridge Street, Suite 1020, Boston, MA 02114 617.626.7339 Mark.Sylvia@State.MA.US www.mass.gov/doer 14 Creating A Cleaner Energy Future For the Commonwealth
