Mastering Candlesticks and Chart Patterns for Trading Success
Candlesticks and chart patterns are like the alphabet and language of the financial market, enabling traders to decipher market sentiment and make informed trading decisions. Learn to identify and trade classic chart patterns such as double tops, double bottoms, head and shoulders, and more to anticipate market reversals and trends effectively.
Download Presentation

Please find below an Image/Link to download the presentation.
The content on the website is provided AS IS for your information and personal use only. It may not be sold, licensed, or shared on other websites without obtaining consent from the author.If you encounter any issues during the download, it is possible that the publisher has removed the file from their server.
You are allowed to download the files provided on this website for personal or commercial use, subject to the condition that they are used lawfully. All files are the property of their respective owners.
The content on the website is provided AS IS for your information and personal use only. It may not be sold, licensed, or shared on other websites without obtaining consent from the author.
E N D
Presentation Transcript
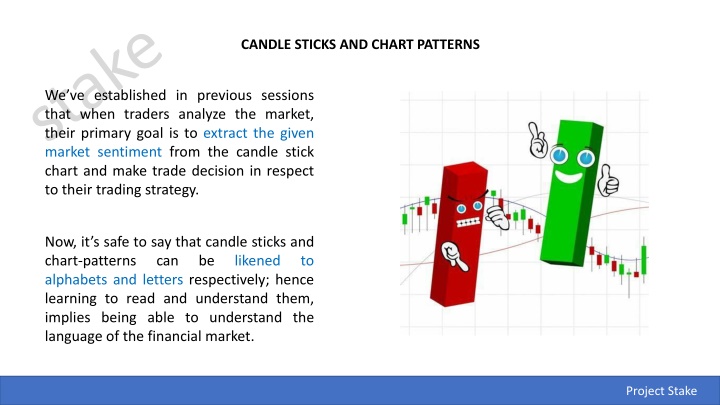
CANDLE STICKS AND CHART PATTERNS We ve established in previous sessions that when traders analyze the market, their primary goal is to extract the given market sentiment from the candle stick chart and make trade decision in respect to their trading strategy. Now, it s safe to say that candle sticks and chart-patterns can alphabets and letters respectively; hence learning to read and understand them, implies being able to understand the language of the financial market. be likened to Project Stake Project Stake
CANDLE-STICK PATTERNS A chart pattern is a visual formation or shape within a price chart that provides clues to what prices might do next. They tell the story of the given market sentiment from a broad perspective. Hence we have a framework to analyze the battle between bulls and bears. with this, the stronger power can be determined, allowing traders to position themselves accordingly. Project Stake
LIST OF CLASSIC CHART PATTERNS Double Tops and Double Bottoms Heads and shoulders (inverse and none-inverse) Rising and Falling Wedges Bullish and Bearish Rectangles Bearish and Bullish Pennants Triangles (Symmetrical, Ascending, and Descending) Project Stake
HOW TO IDENTIFY AND TRADE CHART PATTERNS One top Two tops Double Tops The tops are peaks that are formed when the price hits a certain level that can t be broken. A double top is a reversal pattern that is formed after there is an extended move up. We are to place our entry order below the neckline because we are anticipating a reversal of the uptrend. Neck Line Looking at the chart you can see that the price breaks the neckline and makes a nice move down. Price drops down Project Stake
Double Bottoms The double bottom is also a trend reversal formation, but this time we are looking to go long instead of short. neckline Notice how the second bottom wasn t able to significantly break the first bottom. first bottom second bottom This is a sign that the selling pressure is about finished, and that a reversal is about to occur. price moves up With the double bottom, we would place our entry order above the neckline because we are anticipating a reversal of the down trend. neckline Looking at the chart you can see that the price breaks the neckline and makes a nice move down. Project Stake
Head and shoulders Head Like the double bottom and tops, the head and shoulders pattern is also a trend reversal formation. First shoulder Second shoulder The head is the second peak and is the highest point in the pattern. The two shoulders also form peaks but do not exceed the height of the head. neckline A neckline is drawn by connecting the lowest points of the two troughs. With this formation, we put an entry order below the neckline. neckline You can see that once the price goes below the neckline it makes a move that is at least the size of the distance between the head and the neckline. Price drops Project Stake
Inverse Head and shoulders These formations occur after extended downward movements. This is just like a head and shoulders pattern, but it s flipped upside down. Neckline Shoulder Shoulder With this formation, we would place a long entry order above the neckline. Head Price moves up Measure the distance between the head and the neckline, and that is approximately the distance that the price will move after it breaks the neckline. Neckline Project Stake
Rising Wedge Upward sloping resistance A rising wedge is formed when the price consolidates between upward sloping support and resistance lines. Consolidation Upward sloping support The slope of the support line should be steeper than that of the resistance. With prices consolidating, we can expect a breakout to either the top or bottom. If the rising wedge forms after an uptrend, it s usually a bearish reversal pattern. Downward price break out On the other hand, it could signal a continuation of the down move if it forms during a downtrend. Project Stake
Lets take a look at another example of a rising wedge formation. Only this time it acts as a Bearish continuation signal Price came from a downtrend before consolidating and sketching higher highs and even higher lows. Down Trend Consolidation Down Trend resumes from price breakout Project Stake
Falling Wedge Downtrend Unlike the rising wedge, the falling wedge is a bullish chart pattern. Lower Highs Like the rising wedge, the falling wedge can either be a reversal or continuation signal. Lower lows In this example, the falling wedge serves as a reversal signal. After a downtrend, the price made lower highs and lower lows. In this case, at the upward break out, price went a few more pips beyond that target! Price breaks out upwards Project Stake
Here is an example where the falling wedge serves as a continuation signal. Price consolidated for a bit after a strong rally. This could mean that price tapered down from bulls exhaustion. Soon afterwards price broke to the top side with a strong move Lower Highs Price upward break out signals continuation of uptrend Lower lows Uptrend Project Stake
Rectangles Resistance A rectangle is a chart pattern formed when the price is bound by parallel support and resistance levels. In the example above, we can clearly see that the pair was bound by two major price levels which are parallel to one another. Support To place entries with rectangles, we wait until one of these levels get broken through before we buy or sell. Project Stake
Bullish Rectangles For a bullish rectangle, after an uptrend, price consolidates temporarily before it breaks out upward to continue the trend. Price breakout upwards. rectangle uptrend Project Stake
Bearish Rectangles A bearish rectangle is the inverse condition of the bullish rectangle. It is formed when price consolidates for a while during a downtrend before taking its breakout, downwards. Downtrend Rectangle Price breaks out downwards Project Stake
Pennants After a big move, buyers or sellers usually pause to catch their breath before taking the pair further in the same direction. Because of this, the price usually consolidates and forms a tiny symmetrical triangle (symmetry is with the support and resistance lines ), which is called a pennant. More buyers or sellers usually decide to jump in on the strong move while the price is still consolidating, this forces price to bust out of the pennant formation on either directions of the market. Project Stake
Bullish Pennants In this example, the price made a sharp vertical climb before taking a brief consolidation. Afterwards, the price broke out upwards to continue the bull trend. Uptrend continues Consolidation Uptrend Uptrend Project Stake
Bearish Pennants downtrend A bearish pennant is formed during a steep, almost vertical, downtrend. After the sharp drop in price, some sellers close their positions and some others join the trend, this causes price to consolidate temporarily. Brief consolidation The drop resumed after the price made a breakout to the bottom as a result of new influx of bears and possible exit of more bulls. downtrend To trade this chart pattern, we d put a short order at the bottom of the pennant with a stop loss above the pennant. Downtrend continues Project Stake
Triangle pattern A triangle chart pattern is created when price move into a tighter and tighter range as time goes by. It is often considered a continuation pattern. A triangle pattern is generally considered to be forming when it includes at least five touches of support and resistance. Popular triangle patterns Symmetrical Triangle Ascending Triangle Descending Triangle Project Stake
Symmetrical triangle The slope of the price highs and lows converge together to a point where it looks like a triangle. It s a type of price consolidation Price surged up Project Stake
Ascending triangle An ascending triangle is a type of triangle chart pattern that occurs when there is a resistance level and a slope of higher lows. Although price goes up most of the time, it is important to note that the breakout could take any direction. Project Stake
Descending triangle Descending triangles are the exact opposite of ascending triangles. There is a set of lower highs that forms the upper line. The lower line is the strong support level. The trade entry signal is the same price breakout signal peculiar to other Triangles. Lower High Price broke out upwards support Consolidation area Project Stake

![Guardians of Collection Enhancing Your Trading Card Experience with the Explorer Sleeve Bundle [4-pack]](/thumb/3698/guardians-of-collection-enhancing-your-trading-card-experience-with-the-explorer-sleeve-bundle-4-pack.jpg)


