Mastering Factor Analysis in SAS for Data Analytics
Explore factor analysis basics in SAS Essentials for Data Analytics, learn to extract, rotate factors, and compute factor scores for improved data interpretation. Understand the process of dimension reduction and latent variables in factor analysis.
Download Presentation

Please find below an Image/Link to download the presentation.
The content on the website is provided AS IS for your information and personal use only. It may not be sold, licensed, or shared on other websites without obtaining consent from the author. If you encounter any issues during the download, it is possible that the publisher has removed the file from their server.
You are allowed to download the files provided on this website for personal or commercial use, subject to the condition that they are used lawfully. All files are the property of their respective owners.
The content on the website is provided AS IS for your information and personal use only. It may not be sold, licensed, or shared on other websites without obtaining consent from the author.
E N D
Presentation Transcript
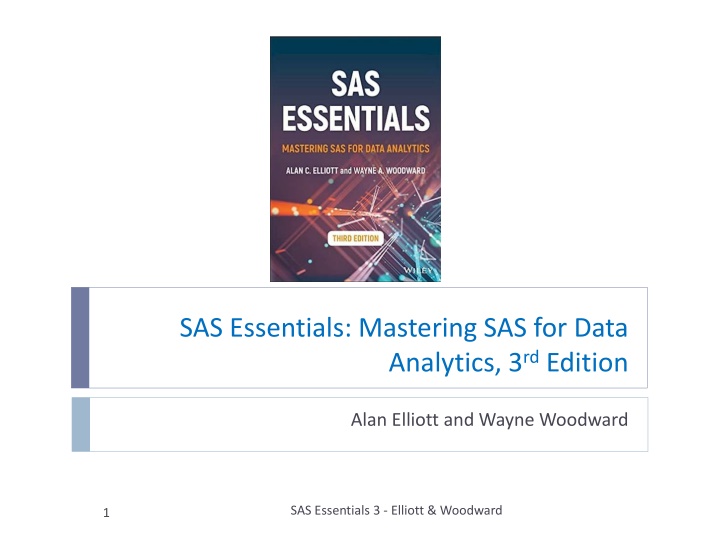
SAS Essentials: Mastering SAS for Data Analytics, 3rdEdition Alan Elliott and Wayne Woodward SAS Essentials 3 - Elliott & Woodward 1
Chapter 18: FACTOR ANALYSIS These slides are provided to help you use to teach SAS using SAS Essentials, 3rd Edition (Elliott and Woodward). Feel free to modify them for your own needs. Please send comments about errors in the slides (or suggestions for improvements) to sas@alanelliott.com. Files available at www.alanelliott.com/sas. Thanks 2 SAS Essentials 3 - Elliott & Woodward
LEARNING OBJECTIVES To be able to perform an exploratory factor analysis using PROC FACTOR To be able to use PROC FACTOR to identify underlying factors or latent variables in a dataset To be able to use PROC FACTOR to rotate factors for improved interpretation To be able to use PROC FACTOR to compute factor scores 3 SAS ESSENTIALS -- Elliott & Woodward
Where to Get Hands-On Data Files As discussed in Chapter 1, the files used in the examples are located on the web at http//:www.alanelliott.com/sas Refer to the information in the first tutorial, or in the SAS ESSENTIALS text for additional information on how to download these files from the web, and copy them to you computer. 4 SAS Essentials 3 - Elliott & Woodward
Factor Analysis Factor analysis is a dimension reduction technique designed to express the actual observed variables using a smaller number of underlying latent variables. Exploratory factor analysis involves identifying factors, determining which factors are needed to satisfactorily describe the original data, interpreting the meaning of these factors, and so on. Confirmatory factor analysis involves techniques for testing hypotheses to confirm theories, and so on. 5 SAS ESSENTIALS -- Elliott & Woodward
18.1 FACTOR ANALYSIS BASICS The typical steps in performing an exploratory factor analysis are the following: (a) Compute a correlation (or covariance) matrix for the observed variables. (b) Extract the factors (this involves deciding how many factors to extract, the method to use, and the values to use for the prior communality estimates). (c) Rotate the factors to improve interpretation. (d) Compute factor scores (if needed). Factor analysis can be quite subjective without unique solutions. Consequently, there is a certain amount of "art" involved in any factor analysis solution. 6 SAS ESSENTIALS -- Elliott & Woodward
18.1.1 Using PROC Factor The SAS procedure used to perform exploratory factor analysis is PROC FACTOR. A simplified syntax for this procedure is as follows: PROCFACTOR <Options> ; VAR variables ; PRIORS communalities; RUN; 7 SAS ESSENTIALS -- Elliott & Woodward
Table 18.1 Common Options for PROC FACTOR Option Explanation DATA = dataname METHOD=option Specifies the estimation method. Options include ML and PRINCIPAL MINEIGEN=n Specifies the smallest eigenvalue for retaining a factor. NFACTORS=n Specifies the maximum number of factors to retain NOPRINT Suppress output PRIORS= option PRIORS=SMC (squared multiple correlations) ROTATE = name Specifies the rotation method. The default is ROTATE=NONE. Common rotation methods are VARIMAX, QUARTIMAX, EQUAMAX, and PROMAX. All of the above are orthogonal rotations except PROMAX. SCREE Displays a Scree plot of the eigenvalues. SIMPLE Displays means, standard deviations, and number of observations CORR Displays the correlation matrix Specifies which dataset to use. Specifies the method for obtaining prior communalities 8 SAS ESSENTIALS -- Elliott & Woodward
Common Statements for PROC FACTOR (Table 18.1 Continued) VAR variable list; Specifies the numeric variables to be analyzed. Default is to use all numeric variables BY, FORMAT, LABEL, WHERE procedures, and may be used here. These statements are common to most NOTE: If the Methods=Principal option is used, then principal component analysis is performed when the PRIORS= option is not used or is set to ONE (the default). If you specify a PRIORS= value other than PRIORS=ONE, then a principal factor method analysis is performed. A common usage is PRIORS=SMC (squared multiple correlations) in which case the prior communality for each variable is the squared multiple correlation of it with all other variables. After extracting the factors, the communalities represent the proportion of the variance in each of the original variables retained after extracting the factors. 9 SAS ESSENTIALS -- Elliott & Woodward
DO HANDS-ON EXAMPLE 18.1 PRELIMINARY: Two of the types of intelligence are Logical- Mathematical Intelligence and Linguistic Intelligence. In this example, we examine a hypothetical dataset that contains six variables, each measured on a 0- 1 0 scale as follows: COMPUTATION - Test on mathematical computations VOCABULARY - A vocabulary test INFERENCE - A test of the use of inductive and deductive inference REASONING - A test of sequential reasoning WRITING - A score on a writing sample GRAMMAR - A test measuring proper grammar usage. 10 SAS ESSENTIALS -- Elliott & Woodward
Using PROC LOGISTIC Open the program file AFACTOR1.SAS PROCFACTOR DATA=MYSASLIB.INTEL SIMPLE CORR SCORE METHOD=PRINICPAL ROTATE=VARIMAX OUT=FS PRIORS=SMC PLOTS=SCREE; RUN; Displays common statistics Specifies the estimation method. Specifies rotation method Specifies the method for obtaining prior communalities Requests SCREE plot 11 SAS ESSENTIALS -- Elliott & Woodward
Run the program and Observe Output Simple Statistics 12 SAS ESSENTIALS -- Elliott & Woodward
Correlation Matrix for Six Variables The high pairwise correlations among COMPUTATION, INFERENCE, and REASONING (to a lesser extent) seem to indicate some tendency to measure Math Intelligence while the variables VOCABULARY, WRITING, and GRAMMAR that seem to be measuring Linguistic Intelligence are also positively pairwise correlated. 13 SAS ESSENTIALS -- Elliott & Woodward
Prior Communality Estimates Because we specified METHOD=PRINCIPAL and PRIORS=SMC, SAS uses the principal factors method where the prior communality estimate for each variable is the squared multiple correlation of it with all other variables. These prior communality estimates are given in this table Estimates closest to 1, means the variable is better explained by the factors. 14 SAS ESSENTIALS -- Elliott & Woodward
Eigenvalues This table displays eigenvalues associated with the factors based on the reduced correlation matrix. It is clear from the table that there are two dominant eigenvalues (2.319 and 1.725). Based on any reasonable criterion, it is clear that a two-factor solution should be used. 15 SAS ESSENTIALS -- Elliott & Woodward
Scree Plot The Scree Plot gives a visual illustration of the sizes of the eigenvalues. It is clear that there are two dominant eigenvalues. Note the big eigenvalue falloff after the 2nd factor. 16 SAS ESSENTIALS -- Elliott & Woodward
Communality Estimates The communalities in this table are the proportion of the variance in each of the original variables retained after extracting the factors. It seems that all six variables are sufficiently well represented by the two factors, with variable REASONING having the smallest communality, 0.335. 17 SAS ESSENTIALS -- Elliott & Woodward
Factor Pattern Matrix In this table, it can be seen that for Factor 1, each variable has a positive coefficient ranging from .41 for REASONING to .77 for WRITING. A reasonable interpretation of this factor is that it is an overall measure of intelligence. The second factor (Factor 2) has negative loadings on the variables measuring Linguistic Intelligence and positive coefficients on the others. 18 SAS ESSENTIALS -- Elliott & Woodward
Interpreting the Factor Analysis Results Based on the less than ideal interpretability of these factors, we use a rotation in hope of producing more interpretable results. (Recall that by construction, there should be two factors: Math Intelligence and Linguistic Intelligence.) Using the option ROTATE=VARIMAX, we have instructed SAS to perform a Varimax rotation. SAS provides several rotation options, and Varimax is a popular "orthogonal rotation," which produces two orthogonal factors that are potentially easier to interpret. 19 SAS ESSENTIALS -- Elliott & Woodward
Interpreting the Rotated Factor Pattern Matrix In this table the coefficients for COMPUTATION are the correlations of the variable COMPUTATION with each of the two factors. There is a large positive correlation between COMPUTATION and Factor 2 and a very small correlation between COMPUTATION and Factor 1. Similar interpretations show that Factor 1 is highly correlated with the three variables measuring Linguistic Intelligence and Factor 2 tends to correspond to Math Intelligence. 20 SAS ESSENTIALS -- Elliott & Woodward
Storing Factor Scores Suppose you want to calculate factor scores and save them in a temporary working file FSCORES. In order to accomplish this, add the following PROC FACTOR options before PLOTS= SCREE; PROCFACTOR DATA=MYSASLIB.INTEL SIMPLE CORR SCORE METHOD=PRINICPAL ROTATE=VARIMAX OUT=FS PRIORS=SMC SCORE NFACTOR=2 OUT=FSCORE PLOTS=SCREE; RUN; Outputs a SAS dataset named FSCORE 21 SAS ESSENTIALS -- Elliott & Woodward
Print Results Then, after the RUN; statement add the code PROCPRINT DATA=FSCORE; VAR FACTORl FACTOR2; RUN; 22 SAS ESSENTIALS -- Elliott & Woodward
Results of OUT=FSCORE Linguistic Math The two-factor scores are given the default names FACTOR1 and FACTOR2 (the prefix "FACTOR" can be changed using the PREFIX= option). Recalling that Factor 1 is a measure of Linguistic Intelligence and Factor 2 measures Math Intelligence, from the factor scores it can be seen that Subject 1 has a higher Linguistic Intelligence score, Subject 2 seems to have High Math Intelligence, and Subject 3 unfortunately doesn't seem to have strength in either dimension. 23 SAS ESSENTIALS -- Elliott & Woodward
DO HANDS-ON EXAMPLE 18.2 Open the program file AFACTOR2.SAS (Olympic Data) This dataset contains scores of 193 athletes who completed all 10 decathlon events in the 1988 through 2012 Olympic Games. The 10 events in the decathlon are 100-m run, long jump, shot put, high jump, 400-m run, 100-m hurdles, discus, pole vault, javelin, and 1500-m run. These events measure a wide variety of athletic ability, and in this example we use this decathlon dataset to explore whether there are some underlying dimensions of athletic ability. It should be noted that the "times" in the running events are given negative signs so that " larger" values are better than "smaller" values as is the case in the distance measurements 24 SAS ESSENTIALS -- Elliott & Woodward
Factor Analysis Code for Olympic Data PROCFACTOR SIMPLE CORR DATA MYSASLIB.OLYMPIC METHOD=PRINCIPAL MSA PRIORS=SMC ROTATE=VARIMAX OUTSTAT=FACT ALL PLOTS=SCREE; VAR RUNl0 LONGJUMP SHOTPUT HIGHJUMP RUN400 HURDLES DISCUS POLEVAULT JAVELIN RUNl500S; RUN; 25 SAS ESSENTIALS -- Elliott & Woodward
Simple Statistics for Olympic Data Run the program and observe As mentioned earlier, times in the running events are given negative signs so that "larger" values are better than "smaller" values as is the case in the distance measurements. Moreover, the 1500-m results are given in (negative) seconds rather than the usual reporting of minutes and seconds. 26 SAS ESSENTIALS -- Elliott & Woodward
Correlations for Olympic Data There are positive correlations between speed events such as the 100-m run and 100-m hurdles (0.692) and between strength events SHOTPUT and DISCUS (0.748). The 1500-m run is not highly correlated with any of the other events. 400-m run (0.368). X 27 SAS ESSENTIALS -- Elliott & Woodward
Communality Estimates, Olympic Data Since we specified METHOD=PRINCIPAL and PRIORS=SMC, SAS uses the principal factors method where the prior communality estimate for each variable is the squared multiple correlation of it with all other variables. This table shows the prior communality estimates (slightly rearranged from the original output) 28 SAS ESSENTIALS -- Elliott & Woodward
Eigenvalues for Olympic Data 29 SAS ESSENTIALS -- Elliott & Woodward
Eigenvalues for Olympic Data The eigenvalues table shows factors based on the reduced correlation matrix. PROC FACTOR selected three factors. It is clear from the previous table and the Scree plot that there are three dominant eigenvalues. 30 SAS ESSENTIALS -- Elliott & Woodward
The communalities in this table (rearranged slightly from, output) are the proportion of the variance in each of the original variables retained after extracting the factors. It seems that all 10 events are fairly well represented by the three factors, with all communalities above 0.33. However, HIGHJUMP, POLEVALULT, JAVELIN, and RUN1500S all having communalities below 0.4. (Larger is better.) 31 SAS ESSENTIALS -- Elliott & Woodward
As was the case for the unrotated solution for the Intelligence Data, it can be seen that Factor 1 has a positive coefficient, all of which are above 0.4 except for RUN1500S, which has a coefficient of 0.17. Factor Patterns A reasonable interpretation is that Factor 1 measures overall athletic ability, primarily related to the first nine events. Factors 2 and 3 are more difficult to interpret. 32 SAS ESSENTIALS -- Elliott & Woodward
Use ROTATE=VARIMAX Based on the confusing interpretations associated with the Three-Factor solutions given in the previous table, we again use a rotation to produce more interpretable results. Using the option ROTATE=VARIMAX results in the Rotated Factor Pattern Matrix given in in the following slide 33 SAS ESSENTIALS -- Elliott & Woodward
The first rotated factor seems to focus on events 100-m long jump, 400-m run, and 110-m hurdles that involve speed and spring. Factor 2 seems to be primarily an arm strength factor with high coefficients for shot put and long jump and lesser in javelin, pole vault, and high jump. The only event with a large coefficient in Factor 3 is the 1500-m hurdles. This is consistent the correlation matrix that suggested the 1500-m run was "different" from the other events. Rotated Factor Patterns 34 SAS ESSENTIALS -- Elliott & Woodward
18.2 SUMMARY In this chapter, we have discussed methods for using PROC FACTOR to perform exploratory factor analysis. In the Hands-on Examples, we have illustrated the use of rotation to obtain more understandable results. Continue to Chapter 19: CREATING CUSTOM GRAPHS 35 SAS ESSENTIALS -- Elliott & Woodward
These slides are based on the book: Introduction to SAS Essentials Mastering SAS for Data Analytics, 3rd Edition By Alan C. Elliott and Wayne A. Woodward Publisher : Wiley; 3rd edition (March 8, 2023) Language : English Paperback : 496 pages ISBN-10 : 1119901618 ISBN-13 : 978-1119901617 These slides are provided to help you use to teach SAS using SAS Essentials, 3rd Edition (Elliott and Woodward). Feel free to modify them for your own needs. Please send comments about errors in the slides (or suggestions for improvements) to sas@alanelliott.com. Files available at www.alanelliott.com/sas. Thanks. 36 SAS Essentials 3 - Elliott & Woodward

