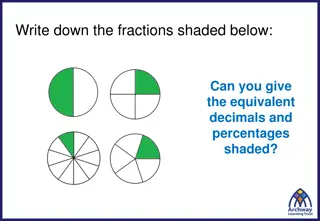
Mastering Pie Chart Angles for Representing Data
Explore how to calculate angles for pie charts to represent various data sets efficiently. Discover worked examples and step-by-step guidance to enhance your understanding of data visualization through pie charts.

Download Presentation

Please find below an Image/Link to download the presentation.
The content on the website is provided AS IS for your information and personal use only. It may not be sold, licensed, or shared on other websites without obtaining consent from the author. If you encounter any issues during the download, it is possible that the publisher has removed the file from their server.
You are allowed to download the files provided on this website for personal or commercial use, subject to the condition that they are used lawfully. All files are the property of their respective owners.
The content on the website is provided AS IS for your information and personal use only. It may not be sold, licensed, or shared on other websites without obtaining consent from the author.
E N D
Presentation Transcript
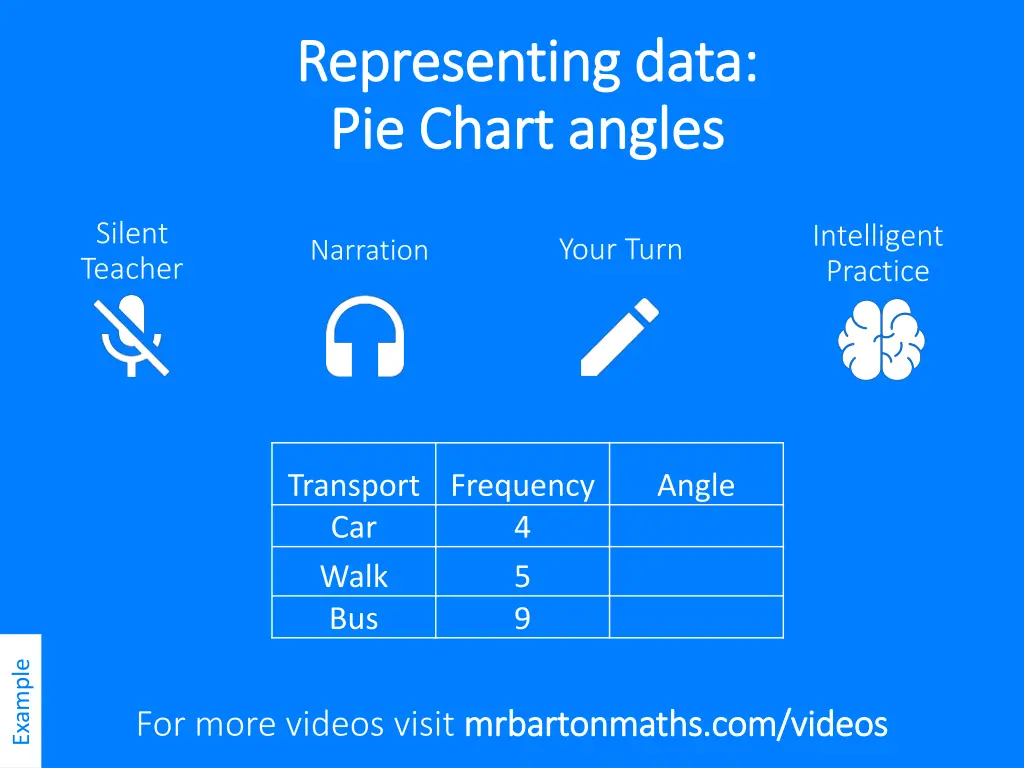
Representing data: Representing data: Pie Chart angles Pie Chart angles Silent Teacher Intelligent Practice Your Turn Narration Transport Frequency Car Walk Bus Angle 4 5 9 Example For more videos visit mrbartonmaths.com/videos mrbartonmaths.com/videos
Worked Example Your Turn Calculate the angles needed to draw a pie chart for this data. Calculate the angles needed to draw a pie chart for this data. Transport Car Walk Cycle Bus Frequency 15 9 9 12 Transport Frequency Car 15 Walk 9 Bus 12 @fortyninecubed
Calculate the angles needed to draw a pie chart to represent each set of data: @fortyninecubed