Mastering Reports: Understand Structure and Utilization
Delve into the world of reports with a focus on understanding their structure and practical applications. Learn how to create and interpret various reports effectively. Discover insights on Jobs by Salesperson, Sq. Ft Installed by Month, Activities by Day of Week, and more.

Download Presentation

Please find below an Image/Link to download the presentation.
The content on the website is provided AS IS for your information and personal use only. It may not be sold, licensed, or shared on other websites without obtaining consent from the author. If you encounter any issues during the download, it is possible that the publisher has removed the file from their server.
You are allowed to download the files provided on this website for personal or commercial use, subject to the condition that they are used lawfully. All files are the property of their respective owners.
The content on the website is provided AS IS for your information and personal use only. It may not be sold, licensed, or shared on other websites without obtaining consent from the author.
E N D
Presentation Transcript
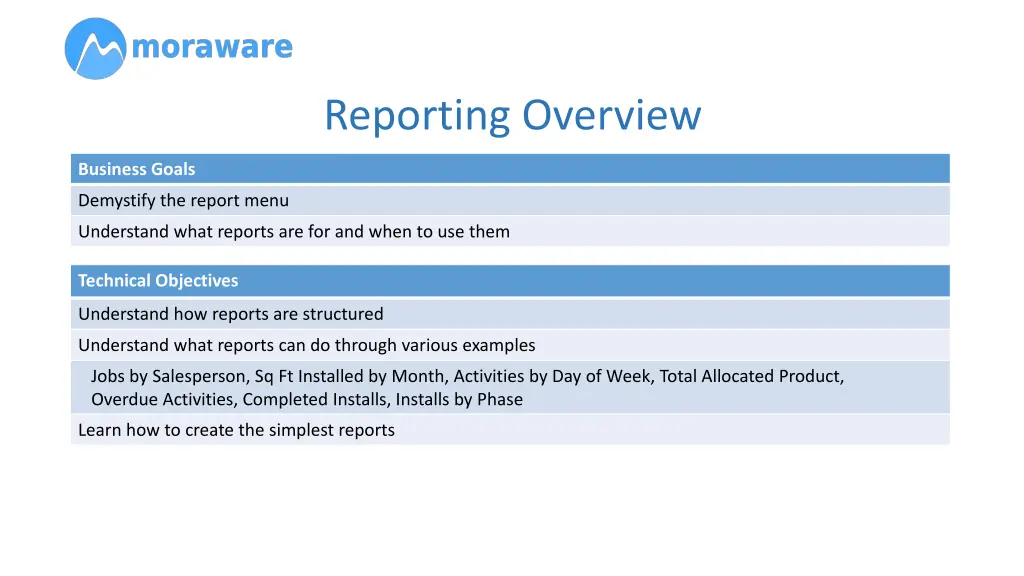
Reporting Overview Business Goals Demystify the report menu Understand what reports are for and when to use them Technical Objectives Understand how reports are structured Understand what reports can do through various examples Jobs by Salesperson, Sq Ft Installed by Month, Activities by Day of Week, Total Allocated Product, Overdue Activities, Completed Installs, Installs by Phase Learn how to create the simplest reports
I wont bite Making a Good Report is Hard Making a Good Report is Hard Reports are hard to master they re very flexible and powerful, but that makes them more complex to understand and learn Don t hesitate to call us for help but remember that it sometimes takes us a while to figure out difficult reports, too!
Account Job Job Phase Phase Activities Forms Files Activities Forms Files Activities Forms
Account Job Job Phase Phase Activities Forms Files Activities Forms Files Activities Forms
Every report either Counts or Adds Counts or Adds Even if you re just trying to get a list, the report still has to count something but it s normal to have a report where each row has a count of 1. While working on a report, always ask yourself, What am I counting or adding?
Square Feet Installed Projected Completed
Installs by Phase
Any report is Only as Good as Your Data Only as Good as Your Data It s important to do a sanity check on your data
Sanity Check: Add More Detail Jobs by Salesperson +Jobs
Exercise: Jobs by Account Try to create a report that counts the number of jobs created this year by each of your Accounts
Moraware makes CounterGo estimating software and JobTracker scheduling software for countertop fabricators. Since 2002 Moraware has helped fabricators quote and schedule more than 2 million countertop installations. Moraware is a member of the MIS+BSI: The Natural Stone Institute, the International Surface Fabricators Association (ISFA), and the Stone Fabricators Alliance (SFA). www.moraware.com


")
")