Mathematical Modeling Study on Cost-Effectiveness of HIV Treatment Delivery Models
Explore a mathematical modeling study on the cost-effectiveness of various HIV treatment delivery models in Zambia, aiming to optimize client-centric care and enhance outcomes. The study assesses different ART delivery models' efficacy and costs, providing insights for future implementation and scale-up of DSD models in HIV treatment programs in sub-Saharan Africa.
Download Presentation

Please find below an Image/Link to download the presentation.
The content on the website is provided AS IS for your information and personal use only. It may not be sold, licensed, or shared on other websites without obtaining consent from the author. If you encounter any issues during the download, it is possible that the publisher has removed the file from their server.
You are allowed to download the files provided on this website for personal or commercial use, subject to the condition that they are used lawfully. All files are the property of their respective owners.
The content on the website is provided AS IS for your information and personal use only. It may not be sold, licensed, or shared on other websites without obtaining consent from the author.
E N D
Presentation Transcript
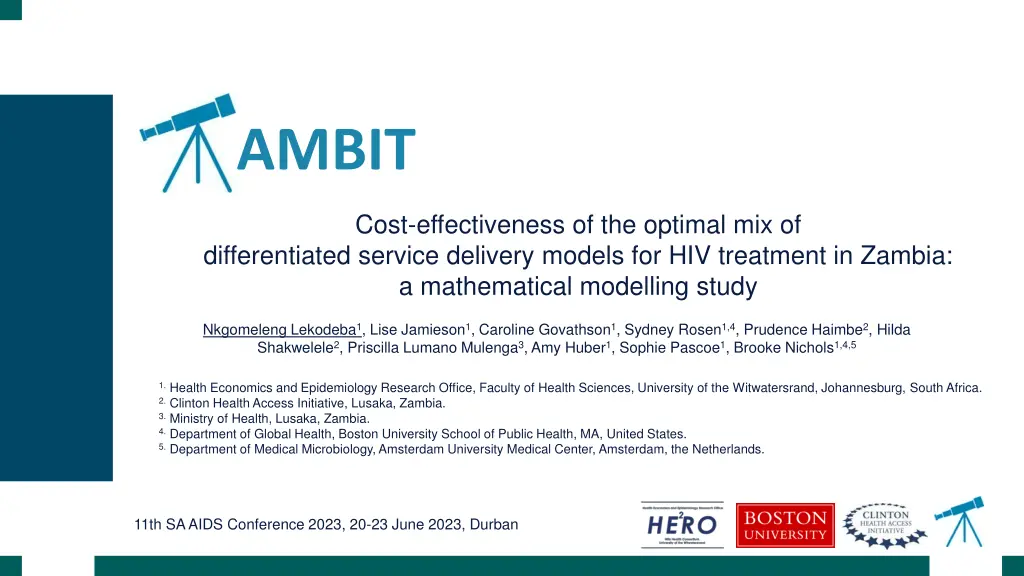
AMBIT Cost-effectiveness of the optimal mix of differentiated service delivery models for HIV treatment in Zambia: a mathematical modelling study Nkgomeleng Lekodeba1, Lise Jamieson1, Caroline Govathson1, Sydney Rosen1,4, Prudence Haimbe2, Hilda Shakwelele2, Priscilla Lumano Mulenga3, Amy Huber1, Sophie Pascoe1, Brooke Nichols1,4,5 1. Health Economics and Epidemiology Research Office, Faculty of Health Sciences, University of the Witwatersrand, Johannesburg, South Africa. 2. Clinton Health Access Initiative, Lusaka, Zambia. 3. Ministry of Health, Lusaka, Zambia. 4. Department of Global Health, Boston University School of Public Health, MA, United States. 5. Department of Medical Microbiology, Amsterdam University Medical Center, Amsterdam, the Netherlands. 11th SA AIDS Conference 2023, 20-23 June 2023, Durban
Background Many countries in sub-Saharan Africa have rapidly scaled up differentiated service delivery (DSD) models for HIV treatment to provide more client-centric care and manage high numbers of clients on lifetime ART. In most countries, DSD models evolved organically based on the availability of infrastructure, staffing, and other resources in hand and on international recommendations. As a result, the current mix of models in use may or may not be optimal, in terms of effectiveness (health outcomes) or costs. Using data from Zambia, we modelled the cost-effectiveness of multiple potential combinations of ART delivery models to guide future implementation and scaleup to maximise the potential benefits of DSD expansion.
Methods Objective: Estimate the incremental cost-effectiveness ratio (ICER) to the health system per additional ART client virally suppressed and costs to clients per year. Developed and parameterised the ADAPT mathematical model using retrospective data from a national cohort of 846,073 ART clients ( 15 years) between January 2018-March 2022. Utilized retention and viral suppression rates by age, sex, setting (urban/rural), and model of HIV treatment delivery. Costs to clients and to providers for each model of ART delivery were estimated using previously collected data.
ADAPT modeling approach Model inputs Table: National distribution of ART clients Disaggregation Data Source Parameters Sex (male/female) Settings (rural/urban) Age groups (15-19, 20-24, 25-49, 50+) ART delivery model (DSD model/Conventional care) Electronic Medical Records SmartCare Health Outcomes Number on ART at baseline Viral suppression and retention rates at 12 months after ART initiation or model enrolment Table: Cost data Disaggregation Data Source Parameters ART delivery model DSD model Conventional care Previously collected data Studies: EQUIP Costs per ART client per year Health system costs Cost to ART clients
ADAPT modeling approach ADAPT modelling approach (3)Outputs for Scenario X by model Base case: Number retained in care Number virally suppressed Provider costs Cost to clients National distribution of ART clients (by age, sex, urban/rural) by DSD model (or not in DSD model) in 2022 (1) National-level outcomes: National number of people retained, suppressed, total health system costs, total costs to clients User-defined scenarios: (s1 x) Number of models and target population for each model (age/sex/urban or rural) (4) (2) Cost-effectiveness analysis (5)
Modelled scenarios Analysis 1: Scenario analysis for the entire ART program Base case: Model defined Scenario DSD model mix Conventional care + 10 DSD models Targeted approaches: All age groups Base case Current ART program 1-10 One model at a time for all eligible clients Total clients: 846,073 DSD coverage: 82.3% 11-18 Two models for all eligible clients 19-26 Three models for all eligible clients Analysis 2: Scenario analysis for the targeted population Base case: Model defined Scenario DSD model mix Conventional care + 8 DSD models Targeted approaches: 15-24 yrs. Base case Current ART program 1-8 One model at a time for all eligible clients Total clients: 21,448 DSD coverage: 70.1% 9-12 Two models for all eligible clients 13-14 Three models for all eligible clients Model-specific retention rates were used as weights to decide on the distribution of clients between chosen models for scenarios. Only established ART clients were eligible for DSD models
Results: Cost-effectiveness frontier Cost-effectiveness analysis of scenarios that generate more suppressed individuals than base case for the entire ART program (N=846 703) 35000 FBIM:MMD6 30000 Incremental number of people virally All eligible ART clients in MMD6 All eligible in MMD6 & CADP All eligible in fast track refills 25000 20000 ICER: Incremental cost to the healthcare system per additional person suppressed on treatment suppressed 15000 FBIM: FTRs 10000 FBIM: Facility-based individual model MMD6: Six-month dispensing FTRs: Fast track refills OFBIM: Out-of-facility-based individual model CADP: Community-ART distribution points FBIM: MMD6 & OFBIM: CADP 5000 0 $- 600 $- 400 $- 200 $- $ 200 $ 400 $ 600 $ 800 Incremental cost to the healthcare system per additional person suppressed on treatment
Results: Costs (entire ART program) Scenarios on the cost-effectiveness frontier that are cost-saving compared to the base case $120.0 Modelled scenarios on the cost-effectiveness frontier (compared to the base case) $100.4 $100.0 $91.0 $92.1 $87.9 $84.8 National Outcomes Base case MMD6 (% ) MMD6 & CADP (% ) FTRs (% ) $83.1 $81.6 $80.1 $80.0 Costs (millions) $92.1 mil $80.1 mil (-13.1) $81.6 mil (-11.4) $83.1 mil (-9.8) Health system costs $60.0 $40.0 $8.2 mil $4.7 mil (-42.8) $6.3 mil (-23.4) $7.9 mil (-4.0) Cost to clients $20.0 n.a. Cost- saving $545 $565 ICER $8.2 $7.9 $6.3 $4.7 $0.0 Base Case FBIM: MMD6 FBIM: MMD6 & OFBIM: CADP FBIM: FTRs Total costs Health system costs Costs to clients
Results: Health outcomes (entire ART program) Scenarios on the cost-effectiveness frontier that generate better health outcomes than base case 100 95.1 94.8 94.5 92.7 Modelled scenarios on the cost-effectiveness frontier (compared to the base case) 87.4 87.3 87.2 84.9 80 Health outcomes (%) National Outcomes Base case MMD6 (% ) MMD6 & CADP (% ) FTRs (% ) 60 87.2 (2.3) 87.3 (2.4) 87.4 (2.5) % retained 84.9 40 Number retained 718 206 738 090 738 745 739 320 20 % suppressed 94.5 (1.8) 94.8 (2.1) 95.1 (2.4) 92.7 0 Number suppressed 665 631 697 421 700 179 702 817 Base case FBIM: MMD6 FBIM: MMD6 & OFBIM: CADP % suppressed FBIM: FTRs % retained
Results: Cost-effectiveness frontier Cost-effectiveness frontier of scenarios that generate more suppressed individuals than base case among 15-24 year olds. (N=21 448) 4 000 FBIM: MMD6 Incremental number of people virally All eligible ART clients in MMD6 All eligible in FTRs & MMD6 3 200 All eligible in Fast track refills FBIM: FTRs & MMD6 2 400 suppressed ICER: Incremental cost to the healthcare system per additional person suppressed on treatment 1 600 FBIM: Facility-based individual model MMD6: Six-month dispensing FTRs: Fast track refills 800 FBIM: FTRs - $-300 $-200 $-100 $- $100 $200 $300 Incremental cost to the healthcare system per additional person suppressed on treatment
Results: Costs (targeted: 15-24 year olds) Scenarios on the cost-effectiveness frontier that are cost-saving compared to the base case $2.4 $2.2 $2.5 $2.3 Modelled scenarios on the cost-effectiveness frontier (compared to the base case) $2.2 $2.1 $2.1 $2.1 $2.0 $2.0 National Outcomes Base case MMD6 (% ) FTRs & MMD6 (% ) FTRs (% ) Costs (millions) $1.5 Health system costs $2.0 mil (-10.0) $2.1 mil (-7.3) $2.1 mil (-4.7) $2.2 mil $1.0 Cost to clients $0.5 $130.7k (-36.7) $130.7k (-18.7) $203.6k (-1.4) $206.5k $206,5K $203,6K $167,9K $130,7K $0.0 ICER n.a. $60 $205 $219 Base Case FBIM: MMD6 FBIM: FTRs & FBIM: FTRs FBIM: MMD6 Total costs Health system costs Costs to clients
Results: Health outcomes (targeted: 15-24 year olds) Scenarios on the cost-effectiveness frontier that generate better health outcomes than base case Modelled scenarios on the cost-effectiveness frontier (compared to the base case) 100 85.2 82.8 82.2 82.6 84.1 82.9 79.9 National Outcomes Base case MMD6 (% ) FTRs & MMD6 (% ) FTRs (% ) 80 75.3 Health outcomes (%) 82.8 (2.9) 84.1 (4.2) 85.2 (5.3) % retained 79.9 60 Number retained 17 135 17 752 18 027 18 282 40 % suppressed 82.2 (6.9) 82.6 (7.3) 82.9 (7.6) 75.3 20 Number suppressed 12 898 14 595 14 890 15 151 0 Base case FBIM: MMD6 FBIM: FTRs & FBIM: FTRs FBIM: MMD6 % suppressed % retained
Conclusions Our model found that a combination of: six-month dispensing, community ART distribution points, and fast-track refills could optimise health outcomes and minimise costs. Even small improvements in health outcomes and small decreases in costs can be important!
What the ADAPT model offers The ADAPT model provides general guidance only: It can help broadly inform policy-makers about how changes in DSD model mixes might change health and cost impacts at an aggregate level It cannot determine a single best mix or scale of models for any specific population or setting Smaller, targeted models designed by local stakeholders will still likely be needed to address the specific needs of sub-populations. Countries DSD technical working groups may wish to use ADAPT as one tool for improving HIV treatment service delivery.
Acknowledgments Ministry of Health in Zambia DSD Technical Working Group of the Zambia Ministry of Health Implementing partners in all three countries Bill & Melinda Gates Foundation CQUIN, IAS, and other collaborating organizations AMBIT project teams in Malawi, South Africa, Zambia, and the U.S.


