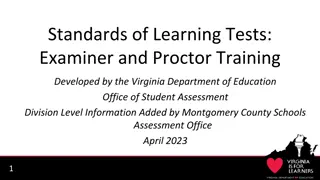
Maximizing Response Rates for Perkins Core Performance Indicator Data Collection
Learn the importance of response rates in accurately portraying post-program placements of CTE concentrators. Low response rates can impact compliance, accuracy, and evaluation of CTE programs. Discover tips to improve response rates and ensure quality data collection.

Download Presentation

Please find below an Image/Link to download the presentation.
The content on the website is provided AS IS for your information and personal use only. It may not be sold, licensed, or shared on other websites without obtaining consent from the author. If you encounter any issues during the download, it is possible that the publisher has removed the file from their server.
You are allowed to download the files provided on this website for personal or commercial use, subject to the condition that they are used lawfully. All files are the property of their respective owners.
The content on the website is provided AS IS for your information and personal use only. It may not be sold, licensed, or shared on other websites without obtaining consent from the author.
E N D
Presentation Transcript
Follow-up Training 2023
Main Purpose: To collect Perkins Core Performance Indicator Post-program Placement (3S1) CTE concentrators who exited during the reporting year Were in placement 2ndquarter after exiting high school: Postsecondary Education/Advanced Training Employment Military Service National and Community Service Programs Peace Corps Volunteers
Post-Program Placement 3S1 Year Total eligible concentrators Response Rate Proxy Rate Self- Survey Placement Employed Continuing Education 2021-22 35,266 84.5% 12.6% 21.3% 95.2% 86.2% 68.4% 2022-23 37,407 86.3% 11.8% 23.6% 95.4% 88.2% 69.9%
Importance of Response Rate Previous verification studies have shown that districts with low response rates often under-report their placement rates because they failed to reach students who were employed during regular weekdays. The value of the data collected through the Follow-Up Survey depends on an accurate report of the status of all concentrators. A good response rate is necessary to accurately portray all concentrators in the state. Perkins V requires states to report post-program placement of all CTE Concentrators. This means that we need to make a good faith effort to survey all qualified concentrators, as well as a good response rate to accurately portray all concentrators in the state. Understand the importance of response rate to the quality of the CPI post-program placement indicator 3S1.
A low response rate negatively affects buildings, CEPDs and the state by reducing the accuracy of the placement information used to evaluate CTE programs. Institutions with response rates below 80% may be found to be in noncompliance during a TRAC onsite monitoring visit. Low Response Rate Districts with one or more buildings with response rates below 50% will be required to send a representative to a technical assistance workshop before next Follow-Up survey.
Tips Caller ID. Make your calls from the school. Students are more likely to answer if interviewers call from the school or they recognize the interviewer s name. Use a cell phone or calling cards which do not activate Caller ID. When to call. It is particularly important that your follow up interviewers attempt to reach students in the evenings and on weekends in addition to during school hours. Answering Machines. It was helpful to leave a message stating the purpose of the call. Students were more apt to answer the next call. A plea for help also works. Disconnects. Try to call a relative listed on the student s emergency card to get a current number. If that fails, try mailing a postcard to the current address or a relative. A disconnected number does not eliminate the student from the pool of concentrators, so you should make every effort possible to reach the student. Reaching students. A phone survey provides the highest response rates. Contact students by e-mail to tell them of the coming survey and to get a current phone number. Ask for e- mail accounts, especially universal accounts like Gmail/Hotmail accounts, before they leave school. Other recommendations for improving the response rate can be found on page 9 in the protocol manual.
Buildings with proxy rates higher than 20% will be required to attend a follow-up training before the next follow up survey. This will be included in the follow-up protocol manual and these buildings will receive a letter indicating the requirement. The proxy rate requirement for the TRAC risk analysis and compliance finding will be reduced. o For TRAC risk analysis: Regions that have 1 or more buildings with a proxy rate greater than 20% will be flagged on the risk analysis. o For TRAC onsite visit: Regions that have a regional proxy rate greater than 20% will receive a finding of noncompliance and be required to prepare a compliance plan. Proxy Rate 7
Use of Follow-up Protocol Manual Response Rate & Proxy Rate requirement Guidance on how to get survey items one by one Background and purpose of follow-up survey
Contact Information Yincheng Ye YeY@michigan.gov YeY@michigan.gov 517-281-7229 Cell