Mean Number of Detections per Trajectory in Aqueous Solutions with Glycerol
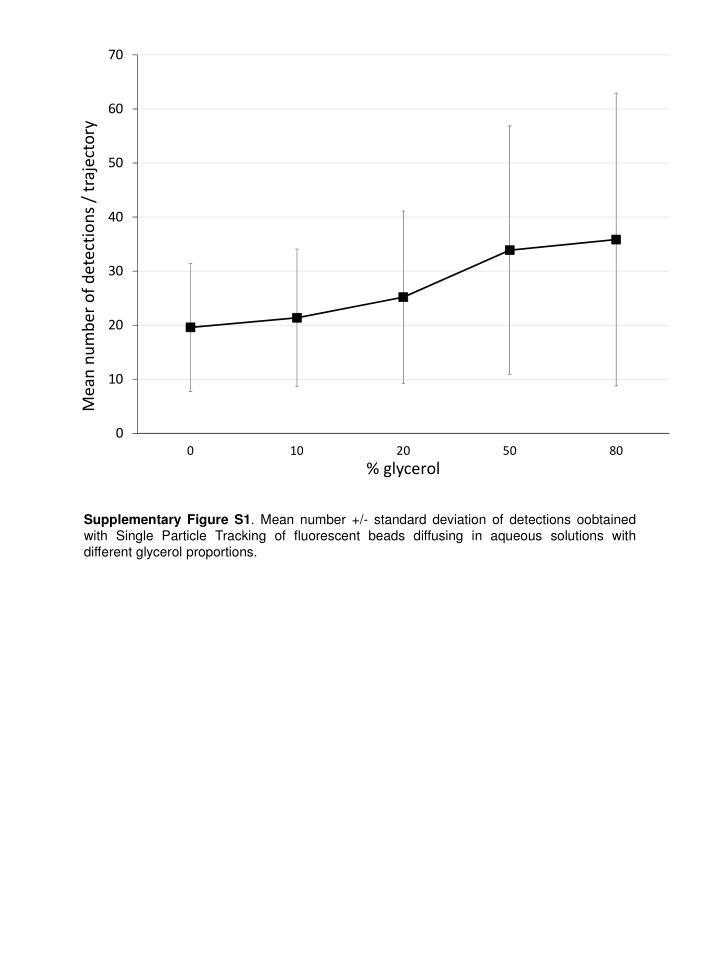
This study presents the mean number and standard deviation of detections obtained through Single Particle Tracking of fluorescent beads diffusing in aqueous solutions with varying glycerol proportions. The data provides insight into the dynamics of particles in different environments and demonstrates how glycerol affects the movement of particles in solution.

Download Presentation

Please find below an Image/Link to download the presentation.
The content on the website is provided AS IS for your information and personal use only. It may not be sold, licensed, or shared on other websites without obtaining consent from the author.If you encounter any issues during the download, it is possible that the publisher has removed the file from their server.
You are allowed to download the files provided on this website for personal or commercial use, subject to the condition that they are used lawfully. All files are the property of their respective owners.
The content on the website is provided AS IS for your information and personal use only. It may not be sold, licensed, or shared on other websites without obtaining consent from the author.
E N D
Presentation Transcript
70 60 Mean number of detections / trajectory 50 40 30 20 10 0 0 10 20 50 80 % glycerol Supplementary Figure S1. Mean number +/- standard deviation of detections oobtained with Single Particle Tracking of fluorescent beads diffusing in aqueous solutions with different glycerol proportions.
A Anomaly coefficient Experimental values Theory % glycerol mean SD 0 0.96 0.01 1 10 0.94 0.02 1 20 0.97 0.02 1 50 1.02 0.02 1 80 0.7 0.02 1 B Diffusion coefficient Experimental values Theory % glycerol mean ? ( m /s) SD D ( m /s) 0 15.5 1.7 15.1 10 12.1 1.8 12.1 20 9.2 1.5 9.0 50 4.5 0.8 3.2 80 1.1 0.2 0.4 SupplementaryTable S1. Comparison of experimental vs theoretical values of anomaly coefficients (A) and diffusion coefficients (B) computed from the ACF of FCS measurements performed with fluorescent beads diffusing in aqueous solutions with different glycerol proportions.
Supplementary Figure S2. Representation of subpopulations identified through the GMM (Gaussian Mixture Model) after mixing batches of trajectories obtained in different conditions, as detailed within the graphics legend.
Calculated by H-MSD analysis 3.76 (SD=0.65) 40% 0.09 (SD=0.02) 60% 3.68 (SD=0.61) 73% 0.09 (SD=0.06) 27% 3.76 (SD=0.63) 24% 0.09 (SD=0.04) 76% A Input D1 ( m /s) % pop 1 D2 ( m /s) % pop 2 D1 ( m /s) % pop 1 D2 ( m /s) % pop 2 D1 ( m /s) % pop 1 D2 ( m /s) % pop 2 4.0 42% 0.1 58% 4.0 75% 0.1 25% 4.0 25% 0.1 75% Mix 1 (m1) Mix 2 (m2) Mix 3 (m3) Calculated by H-MSD analysis 0.88 (SD=0.07) 43% 0.10 (SD=0.05) 57% 0.84 (SD=0.06) 66% 0.11 (SD=0.04) 34% 0.90 (SD=0.07) 23% 0.10 (SD=0.04) 77% B Input D1 ( m /s) % pop 1 D2( m /s) % pop 2 D1 ( m /s) % pop 1 D2 ( m /s) % pop 2 D1( m /s) % pop 1 D2 ( m /s) % pop 2 0.9 46% 0.1 54% 0.9 58% 0.1 42% 0.9 25% 0.1 75% Mix 1 (m1) Mix 2 (m2) Mix 3 (m3) C Calculated by H-MSD analysis 3.95 (SD=0.93) 15% 0.81 (SD=0.04) 85% 4.01 (SD=0.45) 41% 0.82 (SD=0.74) 59% 4.10 (SD=0.45) 67% 0.87 (SD=0.42) 33% Input D1 ( m /s) % pop 1 D2 ( m /s) % pop 2 D1( m /s) % pop 1 D2( m /s) % pop 2 D1( m /s) % pop 1 D2 ( m /s) % pop 2 4.0 20% 0.9 80% 4.0 51% 0.9 49% 4.0 78% 0.9 22% Mix 1 (m1) Mix 2 (m2) Mix 3 (m3) D Calculated by H-MSD analysis 1 population detected D=3.5 m /s (SD=0.7) 1 population detected D=3.6 m /s (SD=0.9) 1 population detected D=3.8 m /s (SD=0.8) Input D1 ( m /s) % pop 1 D2 ( m /s) % pop 2 D1 ( m /s) % pop 1 D2 ( m /s) % pop 2 D1( m /s) % pop 1 D2 ( m /s) % pop 2 4.0 13% 3.8 87% 4.0 46% 3.8 54% 4.0 75% 3.8 25% Mix 1 (m1) Mix 2 (m2) Mix 3 (m3) Supplemental Table S2. Comparison of input values vs h-MSD computed values after mixing batches of trajectories obtained in different conditions.
Total number Nb of D1 Nb of D2 Condition A % D1 % D2 of trajectories trajectories trajectories D1=4 m /s m1 2013 845 42 1168 58 (w :g =100 :0) & D2=0.1 m /s m2 3118 2339 75 780 25 (w :g=20 :80) m3 3369 842 25 2527 75 Total number Nb of D1 Nb of D2 Condition B % D1 % D2 of trajectories trajectories trajectories D1=0.9 m /s m1 2027 932 46 1095 54 (w :g =50 :50) & D2=0.1 m /s m2 3207 1860 58 1347 42 (w :g=20 :80) m3 3633 908 25 2725 75 Total number Nb of D1 Nb of D2 Condition C % D1 % D2 of trajectories trajectories trajectories D1=4.0 m /s m1 4470 894 20 3576 80 (w :g =100 :0) & D2=0.9 m /s m2 4791 2443 51 2348 49 (w :g=50 :50) m3 5119 3993 78 1126 22 Total number Nb of D1 Nb of D2 Condition D % D1 % D2 of trajectories trajectories trajectories D1=4.0 m /s m1 5293 688 13 4605 87 (w :g =100 :0) & D2=3.8 m /s m2 5310 2443 46 2867 54 (w :g=90 :10) m3 5398 4049 75 1350 25 Table 2. Descriptions of mix used to evaluate the performance of our method. We constituted each mix conditions (m) by mixing two different batches of trajectories within glycerol contents D1 and D2 different for each condition (A,B,C). w.g. for Water / Glycerol proportion. method. We constituted each mix conditions (m) by mixing two different batches of trajectories within glycerol contents D1 and D2 different for each condition (A,B,C). w.g. for Water / Glycerol proportion. Supplementary Table S3. Descriptions of mix used to evaluate the performance of our
Supplementary Figure S3. AIC (Akaike Information Criteria) (panel A) and BIC (Bayesian Information Criteria) (panel B) scores corresponding to the n-population analysis of RPB1 SPT trajectories
FCS measurement of RPB1 SPT Measurement of RPB1 pop 1 SPT Measuremnt of RPB1 pop 2 anomalous coefficient Supplementary Figure S4. Diffusion parameters for RPB1 measured by FCS (red dots) and SPT (green dots and blue dots, respectively corresponding to the main and minority subpopulations detected) are gathered in this scatter plot.


")