Meaningful Insights from Conditional Means Analysis
Explore the significance of conditional means in data analysis using a CHD2018 dataset. Visualize the relationship between age and SBP1 through scatter plots, group data by age to calculate mean SBP1, rank and summarize the data. Finally, create a data set containing mean SBP1 by age group and plot the results for further analysis.
Download Presentation

Please find below an Image/Link to download the presentation.
The content on the website is provided AS IS for your information and personal use only. It may not be sold, licensed, or shared on other websites without obtaining consent from the author. If you encounter any issues during the download, it is possible that the publisher has removed the file from their server.
You are allowed to download the files provided on this website for personal or commercial use, subject to the condition that they are used lawfully. All files are the property of their respective owners.
The content on the website is provided AS IS for your information and personal use only. It may not be sold, licensed, or shared on other websites without obtaining consent from the author.
E N D
Presentation Transcript
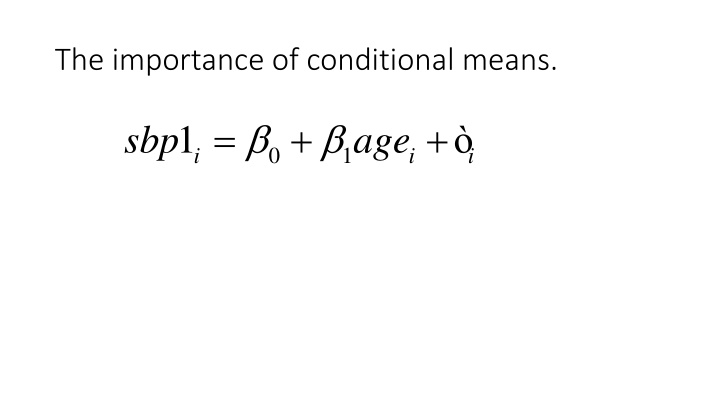
The importance of conditional means. = + + 1i s b p a g e 0 1 i i
The chd2018 data set. proc proc reg model sbp1=age; quit quit; reg data=s5238.chd2018 plots=none;
A scatter plot proc proc sgplot sgplot data=s5238.chd2018; scatter x=age y=sbp1/ markerattrs=(symbol=circlefilled); run run;
Form groups by age and calculate mean sbp1 for each age group
proc proc rank run run; proc proc means means data=toplot; class agegrp; var age sbp1; run run; rank data=s5238.chd2018(keep=age sbp1) out=toplot groups=10 10; var age; ranks agegrp;
Create a data set containing mean of sbp1 by age group proc proc means means data=toplot nway noprint; class agegrp; var age sbp1; output mean= out=means; run run; proc proc print print data=means; run run;
Plot mean sbp1 by mean age in groups proc proc sgplot sgplot data=means; series x=age y=sbp1/markers markerattrs=(symbol=circlefilled); run run;
