Measurement Differences in Testing Changes for Quality Improvement
Explore the key differences between research and process improvement in testing changes, including purposes, bias considerations, data collection approaches, hypothesis flexibility, and change orientation. Learn how to accelerate improvement rates and achieve sustained outcomes.

Download Presentation

Please find below an Image/Link to download the presentation.
The content on the website is provided AS IS for your information and personal use only. It may not be sold, licensed, or shared on other websites without obtaining consent from the author. If you encounter any issues during the download, it is possible that the publisher has removed the file from their server.
You are allowed to download the files provided on this website for personal or commercial use, subject to the condition that they are used lawfully. All files are the property of their respective owners.
The content on the website is provided AS IS for your information and personal use only. It may not be sold, licensed, or shared on other websites without obtaining consent from the author.
E N D
Presentation Transcript
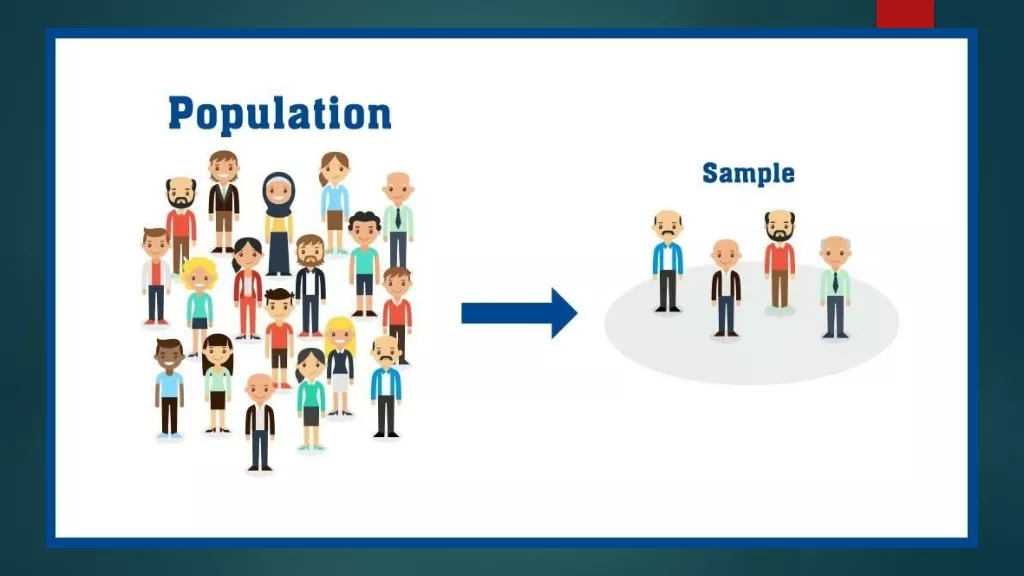
Data Collection & Sampling Data Collection & Sampling BMC s QI Hub is your resource for all things quality improvement. Visit bucme.org/BMCQIHUB or email QIHub@bmc.org for access to professional coaching, educational tools, support, mentorship, and much more!
Disclosure Natalija Farrell has no relevant financial relationships to disclose Some of the slides have been adapted from a previous presentation given by Lauren Betancourt and Emily Jansen (Thank you!)
Introductory Charting Session Learning Objectives Describe measurement differences in testing changes in research versus improvement Differentiate sampling strategies for global project versus PDSA/intervention measures Critically appraise their own data collection plan Apply sampling strategies based on measure type, subject matter expertise, and resources available
Source: Hilton K, Anderson A. IHI Psychology of Change Framework to Advance and Sustain Improvement. Boston, Massachusetts: Institute for Healthcare Improvement; 2018. (Available at ihi.org)
Measurement Differences in Testing Changes Research Quality/Process Improvement Purpose To discover new knowledge To bring new knowledge into daily practice Tests One large blind test Many sequential, observable tests Bias Designed to eliminate bias Accept consistent bias Gather just enough data to learn and complete another cycle Data Gather as much data as possible, just in case Hypothesis Fixed Flexible Small tests of change accelerate the rate of improvement Duration Can take long periods of time to obtain results Testing One large test Sequential tests (PDSAs) Determining Change Statistical tests, p values Run charts or Shewhart control charts Making changes in a vacuum; studying proof of effectiveness Making changes in actual practice; learning what changes will lead to sustained improvement Orientation Clin Perinatol. 2010;37:101-22.
UGH, Data!!!!!!!! Reporting WorkBench How-to s No No How am I going How am I going to get this data to get this data out of EPIC? out of EPIC? Data Support Also no . This is why we sample I have a report but I have no idea how to get the values that show what s important I m going to be doing observations until my eyes bleed
Universal Sampling Rules: Obtain data that is representative of the entire process; samples should be obtained: Under different conditions (high volume days, low volume days) During different days of the week (including weekends) During different times of the day, night or shift By observing/sampling different staff that may influence the value of the data point Q Manage Health Care. 2013;36-46. Q Manage Health Care. 2012;21:170-6.
Sampling for the entire measure set The data accrued for you family of measures will conform to the following attributes: 1. Data will be collected and reviewed through the life of the improvement project and for the purpose of sustainability 2. Data will be collected and reviewed over consistent time intervals 3. The number of data points plotted on the run chart needs to be adequate to detect patterns that may indicate improvement Q Manage Health Care. 2013;36-46. Q Manage Health Care. 2012;21:170-6.
Anticipating the size of the sample required to detect change: Q Manage Health Care. 2013;22:36-47.
Average Waiting Time Q Manage Health Care. 2013;36-46.
Sampling for the first PDSA (test of change) The size of the sample of data needed to evaluate the impact of your first test of change will directly reflect the scale* of the change To determine the scale for your first test of change, you must consider: 1. The team s degree of belief that the change will result in improvement 2. the costs associated with a failed test; and 3. the readiness of those who will have to make the change. *Number of tests, time required, number of staff involved, amount of data Q Manage Health Care. 2013;36-46. Q Manage Health Care. 2012;21:170-6.
Sampling for PDSA: Determining Scale Q Manage Health Care. 2013;36-46.
Grab a seat campaign Aim: To improve patient satisfaction with provider communication in the Emergency Department Test of change/PDSA 1: Place folding seats in patient rooms
Grab a Seat Campaign Results J Patient Exp. 2019;6:110-6.
Sampling for your first PDSA (test of change) The decision about sample size for data collected as part of a PDSA cycle is to obtain just enough data to answer the questions posed in that cycle. Probability Sampling- Also called random sampling Judgement Sampling- sampling strategy determined by subject matter expert Q Manage Health Care. 2013;36-46. Q Manage Health Care. 2012;21:170-6.
Probability Sampling: Simple Random Sampling 20 patients chosen as sample Population: 250 250 patients Sample Size: 20 Simple Random Sampling- each individual within a defined population has an equal opportunity of being chosen
Judgement Sampling More popular approach used in the context of improvement work Samples selected by a nonrandom process for which the biases and sampling errors cannot be calculated from the sample but instead must be settled by subject matter knowledge Judgement sampling examples: Select the times of day we should collect STAT laboratory turnaround times. Select the first 10 patients who arrive in the clinic after 2:00 PM. Select the charts from only patients with 3 or more comorbidities. Interview the next person with diabetes who comes in the office for care. Q Manage Health Care. 2012;21:170-6.
Why is Judgement Sampling the favorable approach in improvement work? 1. We are observing ongoing processes in which the populations are ever-changing 2. When all potential observational units in a population have an equal probability of selection we are not capturing areas of the process that are the most important to understand for the purpose of our aim Q Manage Health Care. 2012;21:170-6.
ED DOAC for DVT Example Patients Receiving DOAC and Counseling by a Pharmacist 100% 2 1 1 1 3 3 1 1 1 90% 80% 70% 60% 2 2 50% 2 40% 30% 20% 10% 0% 1 1 4/16/18- 11/13/17- 12/11/17- 12/25/17- 1/21/18 2/18/18 1/22/18- 2/19/18- 3/19/18- 4/30/18- 5/14/18- 11/27/17- 1/8/18- 2/5/18- 4/29/18 5/13/18 5/27/18 11/26/17 12/24/17 10/16/17- 10/15/17 12/10/17 10/2/17- 10/29/17 2/4/18 3/4/18 4/1/18 1/7/18
ED Hyperglycemia in Admitted Patients Example Average BG Reduction: Run Chart Median Percent Percentage of Patients Admitted with BG>250 mg/dL: P Chart 100% 0 July June October May December January September April August March November February '19 February '20 UCL 90% 80% -50 70% 60% -100 50% LCL 40% -150 30% 20% -200 10% 0% Februar January Februar Septem Novemb Decemb March June August May July October April y '19 y '20 -250 ber er er
ED CHF Treatment Optimization Example Percent Admission to Inpatient or Observation Unit Percent 100% 95% 90% 85% 80% 75% 70% Aug-19 Aug-20 May-19 May-20 Oct-19 Jan-19 Jan-20 Apr-19 Apr-20 Feb-19 Mar-19 Jun-19 Jul-19 Feb-20 Mar-20 Jun-20 Jul-20 Sep-19 Dec-19 Sep-20 Nov-19
Minimum Subgroup Size for P Charts Q Manage Health Care. 2013;36-46.
Natalija Farrell, PharmD, BCPS, DABAT Clinical Coordinator Emergency Medicine Natalija.Farrell@bmc.org BMC s QI Hub is your resource for all things quality improvement. Visit bucme.org/BMCQIHUB or email QIHub@bmc.org for access to professional coaching, educational tools, support, mentorship, and much more!


")


")