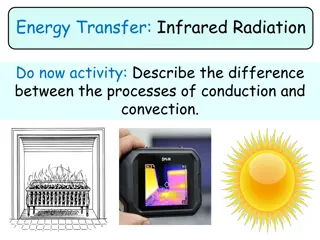
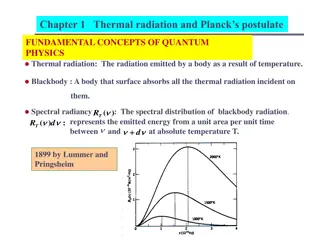
Measurement of Total, Shortwave, and Longwave Radiation Estimation Using Planck's Intensity Law
Measurement of global radiation and bright sunshine using specialized instruments like Campbell-Stokes Sunshine Recorder for accurate estimations. The relationship between actual and potential bright sunshine hours to determine global radiation. Details on measuring and recording sunshine duration with the recorder for precise data collection.

Download Presentation

Please find below an Image/Link to download the presentation.
The content on the website is provided AS IS for your information and personal use only. It may not be sold, licensed, or shared on other websites without obtaining consent from the author.If you encounter any issues during the download, it is possible that the publisher has removed the file from their server.
You are allowed to download the files provided on this website for personal or commercial use, subject to the condition that they are used lawfully. All files are the property of their respective owners.
The content on the website is provided AS IS for your information and personal use only. It may not be sold, licensed, or shared on other websites without obtaining consent from the author.
E N D
Presentation Transcript
Exercise No. 3 Measurement of Total, Shortwave and Longwave Radiation, and Its Estimation Using Planck s Intensity Law
In the absence of the Pyranometers,status of Global radiation reaching the surface of the earth could be computed by using it s relationship with the bright sunshine hours. Global radiation (calories/cm2/day) is directly proportional to the ratio of actual and potential BSS hours.
MEASUREMENT OF BRIGHT SUNSHINE The bright sunshine is measured by means of the Campbell-Stokes Sunshine Recorder. It was invented by John Francis Campbell in 1853 and modified in 1879 by Sir George Gabriel Stokes. This consists of a glass sphere of 10 cm in diameter, mounted concentrically in a section of spherical bowl the diameter of which is such that the sun s rays are focussed sharply on a card, held in the grooved cut into the bowl. There is three overlapping pair of grooves each to take cards suitable in shape for different seasons of the year. There should not be any obstruction having an elevation of 3o above the horizon.
While inserting the new sunshine card, its 12-hr. line should be adjusted to coincide with the noon line engraved on the bowl. The card is subdivided into hourly intervals. As the sun moves across the sky, its focussed image burns a trace on the card, so that by measuring the trace for the whole day, the duration of sunshine during the day can be accurately recorded. The total duration of sunshine can be obtained correct to 0.1 of an hour. Thus sunshine is measured in number of hours per day. For each day s observation, sunshine cards should be inserted in the recorder before sunrise and removed after sunset.
Card Groove Location Date N.Hemisphe re 11/4 to 31/8 11/10 to 28/2 1/9 to 10/10 11/10 to 28/2 11/4 to 31/8 1/3 to 10/4 S.Hemisphe re Long,curved Straight Short, curved Straight Lower intermediate upper intermediate 1/3 to 10/4 1/9 to 10/10
In the Northern hemisphere, the unit is set in a stand facing south to enable the maximum amount of sun to be recorded. It is important to place the unit in an area where the sun will not be blocked by buildings, trees or flagpoles. A modification to the standard unit for polar regions is the addition of a second, north facing, sphere and card, to record the sunlight during the summer when it remains in the sky for 24 hours.
Procedures for recording sunshine measurements Select the appropriate new card corresponding to the season concerned. Insert the new sunshine card in the appropriate groove of the recorder and adjust it so that its 12-hr. line coincides with the noon mark engraved on the bowel. Remove the burnt card in the evening after sunset and mark the date of observation on the reverse of the card. Tabulate the amount of sunshine recorded during each hour of the day from sunrise to sunset using the special plastic scale. Add up the values for all the hours and determine the total duration of sunshine hours of the day.
Precautions for recording sunshine measurements Do not clean the glass bowl of the sunshine recorder with any cloth or material that may abrade the surface. Avoid excessive vigour in polishing. Remove immediately any deposit such as dew, frost, snow or bird droppings. If the trace is not parallel to the central line of the card, or if the intensity of the trace is too high or too low, carry out levelling and other adjustments of the recorder. Use the sunshine cards appropriate for the season.
Computation of Global Radiation Intensity Using BSS Angstrom in 1924 developed a regression equation to compute Total solar radiation (Rs) from BSS data. This relates monthly average daily global radiation to the average daily sunshine hours, and is given by the following expression: Rs = Ra [a+b (n/N)] Where: Rs = Solar radiation at the surface. Ra = Extraterrestrial Radiation at the top of the atmosphere, which differs with latitude; a & b = Constants, a= 0.42 and b=0.30; n = Actual bright sunshine (BSS) duration; N= Maximum possible sunshine duration varies with latitude and time of season of a place
Table. Mean Monthly values of Extraterrestrial Radiation (Cal/cm2/day) for different latitudes in Northen Hemishere Month January February March April May June July August September October November December 00 859 887 895 869 823 793 803 842 879 885 862 846 100 758 821 874 896 887 875 878 885 875 835 774 737 200 638 729 824 897 928 935 935 930 906 848 665 611 300 479 620 752 870 947 974 957 898 794 663 538 465 400 366 497 657 815 936 987 963 867 716 548 399 329
Table. Maximum possible hours of Sunshine (N) for Different latitudes in Northen Hemisphere Month January February March April May June July August September October November December 00 12.1 12.1 12.1 12.1 12.1 12.1 12.1 12.1 12.1 12.1 12.1 12.1 100 11.6 11.8 12.1 12.3 12.6 12.7 12.6 12.5 12.2 11.9 11.7 11.6 200 11.1 11.5 12.0 12.6 13.1 13.3 12.8 13.2 12.3 11.7 11.2 10.9 300 10.4 11.1 12.0 12.9 13.6 14.0 13.9 13.2 12.4 11.5 10.7 10.3 400 9.7 10.6 11.9 13.2 14.3 15.0 14.7 13.8 12.5 11.2 10.0 9.4


 for Different")