Measures of Central Tendency
Learn how to calculate arithmetic mean and geometric mean from given data or frequency distribution. Explore examples and solutions for a clear understanding.

Download Presentation

Please find below an Image/Link to download the presentation.
The content on the website is provided AS IS for your information and personal use only. It may not be sold, licensed, or shared on other websites without obtaining consent from the author. If you encounter any issues during the download, it is possible that the publisher has removed the file from their server.
You are allowed to download the files provided on this website for personal or commercial use, subject to the condition that they are used lawfully. All files are the property of their respective owners.
The content on the website is provided AS IS for your information and personal use only. It may not be sold, licensed, or shared on other websites without obtaining consent from the author.
E N D
Presentation Transcript
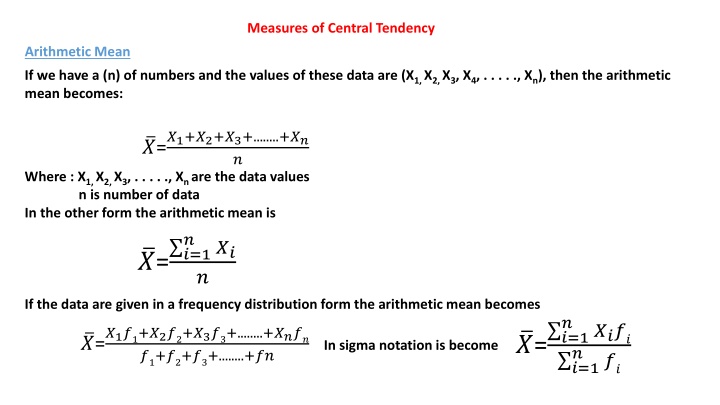
Measures of Central Tendency Arithmetic Mean If we have a (n) of numbers and the values of these data are (X1, X2, X3, X4, . . . . ., Xn), then the arithmetic mean becomes: ?=?1+?2+?3+........+?? ? Where : X1, X2, X3, . . . . ., Xnare the data values n is number of data In the other form the arithmetic mean is ? ?= ?=1 ?? ? If the data are given in a frequency distribution form the arithmetic mean becomes ? ?= ?=1 ???? ?? ?=?1?1+?2?2+?3?3+........+???? ?1+?2+?3+........+?? In sigma notation is become ? ?=1
Example: for the following table find the arithmetic mean Pile length Frequency ?= ?=1 ? Xi(fi) 3(2)=6 ? ???? ?? ???? = 6 + 21 + 8 + 60 + 76 + 42 + 25 + 3 2 ? ?=1 ?=1 7 3 7(3)=21 124 + 228 + 45 + 260 + 360 +204+296 =1755 8 1 8(1)=8 12 5 12(5)=60 19 4 19(4)=76 ? ??= 2 + 3 + 1 + 5 + 4 + 2 + 1 + 4 + 6 + 1 +5 + 6 + 3 + 4 = 47 21 2 21(2)=42 ?=1 25 1 25(1)=25 31 4 31(4)=124 ?=1755 47=37.34 38 6 38(6)=228 45 1 45(1)=45 52 5 52(5)=260 60 6 60(6)=360 68 3 68(3)=204 74 4 74(4)=296
Example: find the average of the following data 20, 30, 25, 23, 22, 32, 36 Solution: ?=20+30+25+23+22+32+36 =26.86 7 Geometrical Mean If we have a (n) of positive numbers and the values of these data are (X1, X2, X3, X4, . . . . ., Xn), then the geometrical mean becomes: ??1.?2.?3 .?? Root equation ? = 1 ? log?? Logarithmic equation log? = If the data are given in a frequency distribution form the geometrical mean becomes ??1 ?1.?2 ?2.?3 ?3 .?? ?? Root equation ? =
? log? =1 ? ??logXi Logarithmic equation ?=1 Example: find the geometrical mean of the following data 20, 30, 25, 23, 22, 32, 36 by using both equation Solution: 720?30?25?23?22?32?36 = 26.32 ??1.?2.?3 .?? ? = ? = 1 ? log? =1 log?? 7 log? = (???20 + ???30 + ???25 + ???23 + ???22 + ???32 + ???36) log? =1 7 (1.301 + 1.477 + 1.4 + 1.362 + 1.342 + 1.505 + 1.556) log? = 1.42043 ? = 26.329
Example: Frequency (fi) Columns Load find the geometrical mean of the following data by using both equations 3 50 - 69 7 70 - 89 Solution: using root equation 4 90 - 109 4 110 129 ??1 ?1.?2 ?2.?3 ?3 .?? ?? ? = 9 130 149 Frequency (fi) Interval center (Xi) Xifi ?1.?2 ?2.?3 ?3 .?? ??= Columns Load ?1 210644.875 x 20071041115808.742 x 98014950.0625 x 203925540.0625 x 20006350286059365992.42 = 1.6906457x1054 210644.875 3 59.5 50 - 69 20071041115808.742 7 79.5 70 - 89 98014950.0625 4 99.5 90 - 109 n = 3+7+4+4+9= 27 203925540.0625 4 119.5 110 129 20006350286059365992.42 9 139.5 130 149 271.6906457x1054 = 101.965 ? =
Solution: using logarithmic equation ? log? =1 ? ??logXi ?=1 Frequency (fi) Interval center (Xi) fi.Log (Xi) Log (Xi) Columns Load 5.323551 1.774517 3 59.5 50 - 69 13.302569 1.900367 7 79.5 70 - 89 7.991292 1.997823 4 99.5 90 - 109 8.309472 2.077368 4 119.5 110 129 19.301166 2.144574 9 139.5 130 149 ? ?=1 ??logXi= 54.22805 n = 27 log? =1 27x 54.22805 = 2.0084463 G = 10 log?= 102.0084463= 101.964
Median The median of a group of data after arrange it by ascending or descending form is the middle number if the group numbers are odd, or the mean of two middle numbers if the group numbers are even. If we have (n) of numbers and the values of these data are (X1, X2, X3, X4, . . . . ., Xn), then the median becomes: Arrangement the data in ascending or descending form. M = X(n+1)/2 if the numbers of data is odd. M =?(? ?(?+?)/? .? ?)+ if the numbers of data is even. ? Example: find the median of the following data 20, 30, 25, 23, 22, 32, 36 36 20 Solution: 32 22 30 23 Arrange data in ascending or descending form 25 25 23 30 The number of data is odd number (n) =7 The median M = (X(n+1)/2) = (X(7+1)/2) = X4 = 25 22 32 descending arrangement Ascending arrangement 20 36
Example: find the median of the following data 20, 30, 25, 23, 22, 32, 36, 18 Solution: 36 18 Arrange data in ascending or descending form 32 20 30 22 The number of data is even number (n) =8 The median M =?(? 25 23 ?(?+?)/? .? ?)+ 23 ? 25 22 descending arrangement X(n/2)= X(8/2)= X4= 23 30 Ascending arrangement 20 32 X(n+2/2)= X(8+2/2)= X5= 25 18 36 M = (23 + 25). (1/2) = 24 Median of frequency distribution have interval: The median interval is the first interval that have a cumulative frequency equal or increase of the half total frequency. ? 2 ?1 ?? ? = ? + .?
Where: n = the summation of frequencies a = the real lower limit of median interval n1= the cumulative frequency of the previous interval of the median interval fm= the frequency of median interval C = the length of median interval M = the median Example: find the median of the following data . Solution: find the cumulative frequency and the summation of frequencies Columns Load Frequency (fi) Cumulative frequency n = 27 n/2 = 13.5 The median interval becomes: 90 - 109 Frequency (fi) Columns Load 50 - 69 3 3 3 50 - 69 70 - 89 7 10 7 70 - 89 90 - 109 4 14 4 90 - 109 Because its cumulative frequency is (14), and this is the first greater or equal frequency of (n/2)=13.5 110 129 4 18 4 110 129 130 149 9 27 9 130 149 ? 2 ?1 ?? ? = ? + .?
Columns Load Frequency (fi) Cumulative frequency Real interval 49.5 69.5 50 - 69 3 3 69.5 89.5 70 - 89 7 10 89.5 109.5 90 - 109 4 14 109.5 129.5 110 129 4 18 129.5 149.5 130 149 9 27 ? 2 ?1 ?? ? = ? + .? a = the real lower limit of median interval = 89.5 n1= the cumulative frequency of the previous interval of the median interval = 10 fm= the frequency of median interval = 4 C = the length of median interval = 20 27 2 10 4 ? = 89.5 + .20 = 107
Mode: is the value that have a largest frequency in such data group. in a frequency distribution the interval that have a largest frequency is called mode interval and its center is called the mode. Example: find the mode of the following data 20, 30, 25, 23, 22, 32, 36, 20, 25, 30, 25 Solution: Data frequency 20 2 Mode = 25 because of its frequency is the largest =3 30 2 25 3 23 1 22 1 32 1 36 1
Example: find the mode of the following data . Frequency (fi) Columns Load 3 50 - 69 7 70 - 89 4 90 - 109 4 110 129 9 130 149 Solution: the largest frequency is (9) and its interval is called mode interval Frequency (fi) The mode = center of mode interval = (130+149)/2 = 139.5 Columns Load 3 50 - 69 7 70 - 89 Note: some data is not have a mode, and some data may be have more than one mode. 4 90 - 109 4 110 129 9 130 149