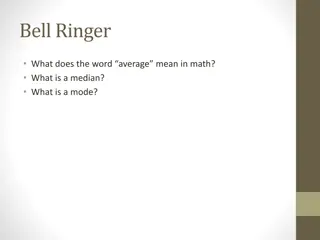
Measures of Central Tendency & Variability in Health Informatics
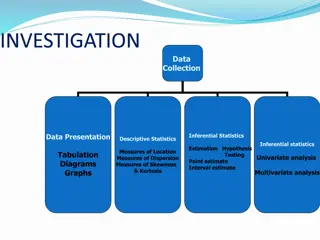
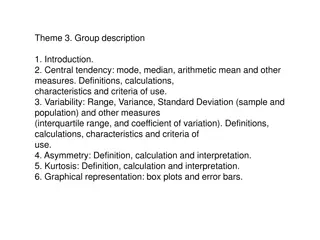
This content discusses various measures of central tendency (mean, mode, median) and explores the concept of nominal, ordinal, and interval/ratio-level data in health informatics. It emphasizes the importance of understanding these statistical measures for data analysis and interpretation in the field of healthcare.

Download Presentation

Please find below an Image/Link to download the presentation.
The content on the website is provided AS IS for your information and personal use only. It may not be sold, licensed, or shared on other websites without obtaining consent from the author.If you encounter any issues during the download, it is possible that the publisher has removed the file from their server.
You are allowed to download the files provided on this website for personal or commercial use, subject to the condition that they are used lawfully. All files are the property of their respective owners.
The content on the website is provided AS IS for your information and personal use only. It may not be sold, licensed, or shared on other websites without obtaining consent from the author.
E N D
Presentation Transcript
Central Tendency & Variability Heibatollah Baghi, Mastaneh Badii, and Farrokh Alemi Ph.D. HEALTH INFORMATICS PROGRAM HI.GMU.EDU
Mean MEASURESOF CENTRAL TENDENCY: MEAN X = X n Count of observations 23, 23, 24, 25, 25 ,25, 26, 26, 27, 28. 25.2 2 HEALTH INFORMATICS PROGRAM GEORGE MASON UNIVERSITY
MEASURESOF CENTRAL TENDENCY: MODE Mode 20, 21, 21, 22, 22, 22, 22, 23, 23, 24 3 HEALTH INFORMATICS PROGRAM GEORGE MASON UNIVERSITY
MEASURESOF CENTRAL TENDENCY: MEDIAN Median 21, 22, 22, 23, 24, 26, 26, 27, 28, 29 50% 50% 4 HEALTH INFORMATICS PROGRAM GEORGE MASON UNIVERSITY
Median 22, 23, 23, 24, 25, 26, 27, 27, 28 50% 50% 5 HEALTH INFORMATICS PROGRAM GEORGE MASON UNIVERSITY
Nominal, Ordinal, and (sometimes) Interval/Ratio-Level Data Ordinal-Level Data and Interval/Ratio-Level data (particularly when skewed) Mode Most frequently occurring value Median Exact center (when odd N) of rank-ordered data or average of two middle values (when even N) Mean Arithmetic average (Sum of Xs/N) Interval/Ratio-Level Data 6 HEALTH INFORMATICS PROGRAM GEORGE MASON UNIVERSITY
COMPARISONOF MEASURESOF CENTRAL TENDENCY Nominal, Ordinal, and (sometimes) Interval/Ratio-Level Data Ordinal-Level Data and Interval/Ratio-Level data (particularly when skewed) Mode Most frequently occurring value Median Exact center (when odd N) of rank-ordered data or average of two middle values (when even N) Mean Arithmetic average (Sum of Xs/N) Interval/Ratio-Level Data 7 HEALTH INFORMATICS PROGRAM GEORGE MASON UNIVERSITY
COMPARISONOF MEASURESOF CENTRAL TENDENCY Mode Most frequently occurring value Nominal, Ordinal, and (sometimes) Interval/Ratio-Level Data Ordinal-Level Data and Interval/Ratio-Level data (particularly when skewed) Median Exact center (when odd N) of rank-ordered data or average of two middle values (when even N) Mean Arithmetic average (Sum of Xs/N) Interval/Ratio-Level Data 8 HEALTH INFORMATICS PROGRAM GEORGE MASON UNIVERSITY
COMPARISONOF MEASURESOF CENTRAL TENDENCYIN NORMAL DISTRIBUTION Frequency Normal 9 HEALTH INFORMATICS PROGRAM GEORGE MASON UNIVERSITY
COMPARISONOF MEASURESOF CENTRAL TENDENCYIN BIMODAL DISTRIBUTION Frequency Bi-modal 10 HEALTH INFORMATICS PROGRAM GEORGE MASON UNIVERSITY
Skewed to Left Frequency Negatively Skewed Outliers pull the mean away From the median 11 HEALTH INFORMATICS PROGRAM GEORGE MASON UNIVERSITY
Skewed to Right Frequency Positively Skewed Outliers pull the mean away From the median 12 HEALTH INFORMATICS PROGRAM GEORGE MASON UNIVERSITY
Frequency Uniform 13 HEALTH INFORMATICS PROGRAM GEORGE MASON UNIVERSITY
Frequency Exponential 14 HEALTH INFORMATICS PROGRAM GEORGE MASON UNIVERSITY
MEASURESOF VARIABILITYOR SCATTER Same Average Different Variability 15 HEALTH INFORMATICS PROGRAM GEORGE MASON UNIVERSITY
MEASURESOF VARIABILITYOR SCATTER: RANGE Range Max 110, 120, 130, 140, 150, 160, 170, 180, 190 Min 16 HEALTH INFORMATICS PROGRAM GEORGE MASON UNIVERSITY
MEASURESOF VARIABILITYOR SCATTER: SEMI INTER- QUARTILE RANGE Standard Quartile Range SQR = (Q3-Q1)/2 17 HEALTH INFORMATICS PROGRAM GEORGE MASON UNIVERSITY
Sum Squares &Variance ss = (X - M)2 ss =n 2 s 1 18 HEALTH INFORMATICS PROGRAM GEORGE MASON UNIVERSITY
Standard Deviation 2 ( X ) X = i S 1 n 19 HEALTH INFORMATICS PROGRAM GEORGE MASON UNIVERSITY
2 ( ) X = 2 SS X Sum of Squares n ss =n 2 s Variance ss 1 = s Standard Deviation 1 n 20 HEALTH INFORMATICS PROGRAM GEORGE MASON UNIVERSITY
Data 110 120 130 140 150 150 160 170 180 190 Total X-M (X - M)2 CALCULATING STANDARD DEVIATION -40 1600 -30 900 -20 400 -10 100 0 0 0 0 10 100 20 400 30 900 40 1600 0 6000 (SS) 9 N-1 Sample Variance Standard Deviation 667 25.8 SS is the key to many statistics 21 HEALTH INFORMATICS PROGRAM GEORGE MASON UNIVERSITY
Calculating formula Defining formula FORMULA VARIATIONS 2 ( ) X Sum of squares 2 ( X ) X = 2 SS X i = 2 s n 1 n ss Variance 2 ( X ) X =n 2 s i = 2 s ss 1 1 n Standard deviation 2 ( X ) X = i = S s 1 n 1 n 22 HEALTH INFORMATICS PROGRAM GEORGE MASON UNIVERSITY
23 HEALTH INFORMATICS PROGRAM GEORGE MASON UNIVERSITY
STANDARDIZED SCORES: Z SCORES Standard Score Z = (x-m) / s 24 HEALTH INFORMATICS PROGRAM GEORGE MASON UNIVERSITY
STANDARDIZED SCORES: Z SCORES Z = (x-m) / s Z = 140 110 / 10 = 3 25 HEALTH INFORMATICS PROGRAM GEORGE MASON UNIVERSITY
Histogram 12 Expected Observed 10 Frequency 8 6 4 2 0 -1.71 -0.95 -0.18 0.59 1.36 More Bin 26 HEALTH INFORMATICS PROGRAM GEORGE MASON UNIVERSITY
Measures of Central Tendency & Variability Can Describe the Distribution of Data