Measures of Dispersion in Animal Genetics & Breeding
Measures of Dispersion quantify the variation in data sets, aiding in determining average reliability, comparing data variability, and facilitating statistical analysis. Methods like Range, Quartile Deviation, and Variance are applied, each with unique merits and demerits in analyzing observations. Explore the significance and properties of these measures to enhance understanding in Animal Genetics & Breeding.

Download Presentation

Please find below an Image/Link to download the presentation.
The content on the website is provided AS IS for your information and personal use only. It may not be sold, licensed, or shared on other websites without obtaining consent from the author.If you encounter any issues during the download, it is possible that the publisher has removed the file from their server.
You are allowed to download the files provided on this website for personal or commercial use, subject to the condition that they are used lawfully. All files are the property of their respective owners.
The content on the website is provided AS IS for your information and personal use only. It may not be sold, licensed, or shared on other websites without obtaining consent from the author.
E N D
Presentation Transcript
ANIMAL GENETICS & BREEDING UNIT I Biostatistics & Computer Application Lecture 12 Measures of Dispersion Variance and Standard Deviation Dr K G Mandal Department of Animal Genetics & Breeding Bihar Veterinary College, Patna Bihar Animal Sciences University, Patna
Measures of Dispersion Variation or scatter of observation in a set of data around a central value is known as Measures of Dispersion. Sl. No. Set 1 Set 2 1. 01 2. 02 3. 03 4. 04 5. 90 Total 100 Mean(x) 20 Set - 3 20 20 20 20 20 100 20 20 18 22 23 17 100 20
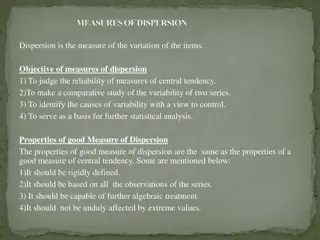
Significance of Dispersion: i. To determine the reliability of an average. ii. To compare two or more sets of data with regard to their variability. iii. To serve as a basis for the control of the variability. iv. To facilitate the use of other statistical measures.
Properties of a good Measure of Dispersion Simple to understand Easy to compute Based on each and every item of the set of observation Can be used for further algebraic treatment Should have sampling stability
Different methods to Measure the Dispersion Range Quartile Deviation Mean Deviation Variance Standard Deviation Standard Error Coefficient of Variation %
Range: Ex. 12, 64, 25, 78, 33. Range = 78 12 = 66 Merit: Easy to compute Demerit: Does not includes all the observations. : Xmax Xmin
Quartile Deviation: Q = 1 Q1 = l1 + [i(? Q3 = l2 + [i(3? Where, l1 & l2 are the lower limits of 1st and 3rd quartile class. i = class interval N = total number of observations cf = Cumulative frequency just preceding f = frequency of quartile class. 2( Q3 Q1 ) 4 - cf)]/f 4 - cf)]/f to quartile class,
Example: Calculate quartile deviation from the following data: _________________________ Wages of labour (Rs. Per week) __________________________ Less than 35 35 37 38 40 41 43 Above 43 freq. cf 14 62 99 18 07 14 76 175 193 200
Q.D. = ?3 ?1 , 2 for Q1 the ? 4th item = 200 4 - cf)]/f 4 = 50th item. Q1 = l1 + [i(? l = 35, N = 200, c.f. = 14, f = 62, I = 2. (200 4 14) 62 Q1 = 35 + x 2 = 36.16
Q3 = l2 + [i(3? For Q3 the 3N/4th item 3x200/4 = 150th l = 38, N = 200, c.f. = 76, f = 99, i = 2 4 - cf)]/f (3?200 4 76) Q3 = 38 + QD = (39.49 36.16)/2 = 1.67 x 2 = 38 + 1.49 = 39.49 99
Mean Deviation : 1/N [ (Xi X)] Sl. No. 1. 2. 3. 4. 5. Total Mean (X) Xi 2 3 4 5 6 20 4 (Xi X) 2 4 3 4 4 4 5 4 6 - 4 (Xi X) -2 -1 0 1 2 0
Variance: Variance is also known as Mean Square (MS) or Mean Sum of Square (MSS). It is defined as mean sum of the square deviation of the values when values are expressed as deviation population mean. Variance : from the 1 ? (Xi X)2
Importance of Variance: 1. One of the most important measures of dispersion: i) Additivity or addition ii) Subdivisibility or partitioning 2. Based on all the observations of a set of data. 3. Easy to understand & easy to compute.
Sample variance is denoted as s2 & Population variance is denoted as 62 (sigma square). S2 =[ xi2 ( x)2/N] N 1 Degree of freedom for sample variance (s2 ) is (N-1) whereas in case of population, DF is N . Unit of variance is the square of the unit in original data.
Variance : 1/N [ (Xi X)2 Variance [ (Xi X)2= (xi2 + x2 - 2xix) = xi2 + x2 - 2x xi = xi2 + Nx2 - 2x Nx = xi2 + Nx2 - 2N x2 = xi2 Nx2 = xi2 N( x)2/N2 = [ xi2 ( x)2/N] N 1
Calculation of variance through direct formula : 1/N [ (Xi X)2 (Xi X)2 4 Sl. No. 1. 2. 3. 4. 5. Total Mean (X) Xi 2 3 4 5 6 20 4 (Xi X) 2 4 3 4 4 4 5 4 6 - 4 (Xi X) -2 -1 0 1 2 0 1 0 1 4 10 Variance = 10/4 = 2.5
Calculation of variance through computational formula Variance =[ x2 ( x)2/N] / (N-1). Sl. No. Xi Xi2 1. 2 2. 3 3. 4 4. 5 5. 6 Total 20 Mean (X) 4 4 9 16 25 36 90 Variance =[ 90 - 202 /5 ] /4 = [90 400/5]/4 = (90 80)/4 = 10/4 = 2.5
Exercise 1. Calculate the variance on daily milk production (kg) of HF crossbred cow from the following information: Dated: 10.11.2020 X2 Sl.No. Daily milk Yield (X) 1. 8 2. 9 3. 10 4. 11 5. 12 6. 13 7. 14 8. 15 9. 9 10. 10 Total
Standard Deviation Standard Deviation : + Variance SD = + [ x2 ( x)2/N] / (N 1). Some important points: 1. The concept of Standard Deviation was given by Karl Pearson in 1823. 2. Standard deviation is the best measure of dispersion. 3. It is based on each and every item of the distribution.
1. It can undergo further algebraic treatment. 2. It is less affected by fluctuation of sampling. 3. It is possible to calculate the combined standard deviation of two or more groups. 4. It takes the original unit of the data. 5. S. D. is the most powerful measure of dispersion because it satisfies almost all the properties for an ideal measure of dispersion.
Exercise 2. Calculate the standard deviation on daily milk production (kg) of HF crossbred cow from the following information: Dated: 10.11.2020 X2 Sl. No. Daily Milk Yield (X) 1. 6 2. 7 3. 8 4. 9 5. 10 6. 11 7. 12 8. 13 9. 14 10. 15


]")