Measures of Dispersion: Understanding Data Spread and Variability
Measures of dispersion help in understanding how spread out the values are from their center, providing insights into the variability of data sets. They include important metrics such as Range, Variance, Standard Deviation, and Coefficient of Variation. Through examples and illustrations, this content explores the calculation and significance of these measures in statistical analysis.
Download Presentation

Please find below an Image/Link to download the presentation.
The content on the website is provided AS IS for your information and personal use only. It may not be sold, licensed, or shared on other websites without obtaining consent from the author.If you encounter any issues during the download, it is possible that the publisher has removed the file from their server.
You are allowed to download the files provided on this website for personal or commercial use, subject to the condition that they are used lawfully. All files are the property of their respective owners.
The content on the website is provided AS IS for your information and personal use only. It may not be sold, licensed, or shared on other websites without obtaining consent from the author.
E N D
Presentation Transcript
statistics statistics For first For first stage prepared by prepared by Aseel Ali Aseel Ali stage
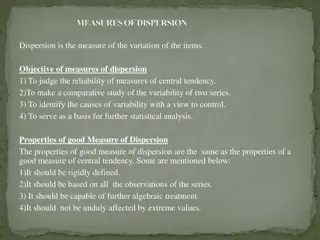
Measures of Dispersion Dispersion is the distance(deviation) away from the center (mean). The distance away from the center is expressed as: (? ? )
Example Example: : These data stay for stay for 5 5 patients. patients. These data show duration of hospital show duration of hospital (? ? ) No. Duration of hospital stay ? 1 2 3 4 5 0 1 1 2 11 15 3 3 3 3 3 -3 -2 -2 -1 8 0 total
The mean for the data The mean for the data ? = = 15 15/ /5 5 = = 3 3 days As a rule, the summation of differences As a rule, the summation of differences away away ???? ??? ???? = ? days (? ?) = ? Measures of dispersion tell us Measures of dispersion tell us how dispersed dispersed the values are from their the values are from their center . center . Measures of dispersion are numerous, Measures of dispersion are numerous, e.g. e.g. Range , variance ( Range , variance (??) , standard deviation ) , standard deviation (?), coefficient of variation. , coefficient of variation. how
1 1- - The Range The Range Range is the difference between the largest and Range is the difference between the largest and smallest values , i.e. , smallest values , i.e. , Maximum value Maximum value minimum value minimum value Example: Example: No. of absence days of No. of absence days of 5 0 0, , 1 1, , 1 1, , 2 2, , 11 11. . Minimum= Minimum= 0 0 days days Maximum= Maximum= 11 11 days days Range : maximum Range : maximum minimum = minimum = 11 5 students : students : 11 0 0 = = 11 11 days days
2 2- - The variance The variance Variance (??) can be calculated as follows: ??= (? ?)? ? ? ? ? Units of variance are the squared units of measurement . ??? ? ?? or ??=
Example: Example: These children (in kg): children (in kg): These data show the weight ( data show the weight (?) of 5 ) of 5 (? ?)2 ? ? ? ? 5 6 6 3 5 5 5 5 5 5 0 1 1 -2 0 0 1 1 4 0
Mean weight for these children = Mean weight for these children = ?? = = 5 5 kg kg (? ?)= = 0 0 (? ?)?= = 6 6 kg kg2 ? ? = ? ? = ? Variance Variance = ? ? ? 2 = (? ?)? = = 6 6/ /4 4 = = 1.5 1.5 kg kg2 2
3 3- -The standard Deviation (s) The standard Deviation (s) Standard deviation (s) is the square root of the Standard deviation (s) is the square root of the variance. variance. Units of the standard deviation are the same Units of the standard deviation are the same units of measurement. units of measurement. The standard deviation can be calculated as The standard deviation can be calculated as follows: follows: (? ?)? ? ? ? =
Example: These data show the weight (x) of 5 children (in kg):
Variance Variance ( (??) ) = Standard deviation (s) = Standard deviation (s) = ?.? kg = 1.22 1.22 kg kg = 1.5 1.5 kg kg2 2 kg =
Coefficient of variation of variation 4 4- -Coefficient Coefficient of variation (cv) is the Coefficient of variation (cv) is the percentage of the standard deviation to the percentage of the standard deviation to the mean, as follows: mean, as follows: Coefficient of variation Coefficient of variation c.v. = c.v. = ???????? ????????? ???? ???% ?.?.= It has no units . It has no units . Example : these data show the weight (x) of Example : these data show the weight (x) of 5 5 children (in kg). children (in kg). As previously calculated: As previously calculated: Mean = Mean = 5 5 kg , standard deviation = kg , standard deviation =1.2 c.v. = ( c.v. = (?.?? ??? ? ? ? ???% 1.2 kg kg ) = ) = 24.4 24.4 % %
Example: if it was ?? ?? ???= ???? ?? ?? = ? , ?=? ?=? Find c.v. Find c.v. Answer: Answer: ? = ?.??? ?.?.=? ???? ?? ??? = ??? ? ?? ? ? ??= ? = ?? , = = ??.??? ?? ? ? ??? =?.??? ???% = ??.??% ??
Homework: If you know that the sum of the squares of the deviations of values from their mean for ten values is 82.665, calculate the variance.
