Measuring Contraceptive Security Indicators 2014 Summary Findings
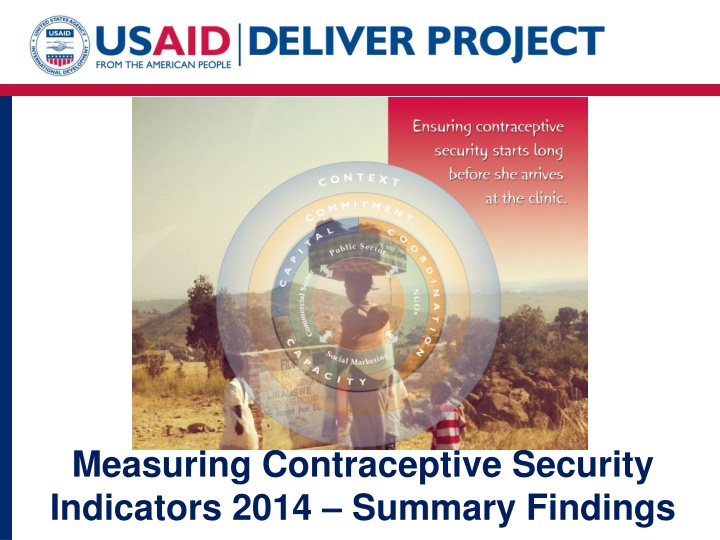
This presentation provides insights into the findings of the 2014 survey on measuring contraceptive security indicators, highlighting the importance of monitoring country-level progress for advocacy, planning, and monitoring purposes. The data collected from 47 countries offers valuable information on finance, policies, commodities, coordination, and supply chain related to contraceptive security. The framework of Strategic Pathway to Reproductive Health Commodity Security (SPARHCS) is utilized to assess the components essential for achieving reproductive health commodity security.

Download Presentation

Please find below an Image/Link to download the presentation.
The content on the website is provided AS IS for your information and personal use only. It may not be sold, licensed, or shared on other websites without obtaining consent from the author.If you encounter any issues during the download, it is possible that the publisher has removed the file from their server.
You are allowed to download the files provided on this website for personal or commercial use, subject to the condition that they are used lawfully. All files are the property of their respective owners.
The content on the website is provided AS IS for your information and personal use only. It may not be sold, licensed, or shared on other websites without obtaining consent from the author.
E N D
Presentation Transcript
Measuring Contraceptive Security Indicators 2014 Summary Findings
Introduction to CS Indicators Why measure contraceptive security (CS)? Country stakeholders and advocates recognize the importance of monitoring country-level progress toward contraceptive security (CS) for advocacy, program planning, and monitoring purposes. How were the indicators defined? In 2009, the USAID | DELIVER PROJECT proposed a set of standard CS indicators some new and some existing for countries to track changes. These indicators are collected annually and have been refined over time.
Introduction to This Presentation This slide deck presents data from 47 countries, collected through the CS Indicators survey in 2014. In addition to the information on each slide, clarifying comments and more information can be found in the slide notes. Not all indicators are represented in this presentation More information can be found in the complete dataset, found here: http://deliver.jsi.com/dlvr_content/resources/allpubs/factsheet s/CSIndiData2013.xlsx o You can also find a blank survey in the complete dataset that can be adapted for your country needs.
Introduction to This Presentation Contraceptive security Definition Framework (SPARHCS) Contraceptive Security Indicators Survey Audience and Uses Limitations 2014 CS Indicators Survey selected findings Finance Policies Commodities Coordination Supply chain Conclusion and additional resources
Contraceptive Security Contraceptive Security (CS) exists when every person is able to choose, obtain, and use quality contraceptives and condoms for family planning and the prevention of sexually transmitted infections.
Reproductive Health Commodity Security Framework The indicators build on the Strategic Pathway to Reproductive Health Commodity Security (SPARHCS) framework The framework is made up of components considered vital to achieving reproductive health commodity security (RHCS).
Contraceptive Security Indicators Survey Key informant survey Conducted annually 40+ countries USAID | DELIVER PROJECT presence countries Tier 1 USAID population and reproductive health countries Topics covered Finance Finance Policies Policies Commodities Commodities Coordination and Leadership Coordination and Leadership Supply Chain Supply Chain
Survey Audience and Uses Intended Audiences Country governments Policymakers CS committees Advocates local and global Program managers Donors Global partners Uses Monitor progress toward CS Identify advocacy and programmatic entry points
Survey Limitations Indicator questions are limited in that they are not intended to require extensive background research Precise data may be difficult for respondents to locate particularly as relates to financing Official policy may vary from actual practice Data are contingent on the knowledge of respondents
2014 Survey 47 countries were surveyed in 2014
2014 Key Findings Commodities Finance Coordination Supply Chain Policies On average, on their National Essential Medicine List On average, countries offer 8 out of 11 methods in the public sector 89% of countries have a committee that works on CS issues 48% of countries had a central-level stockout at some point during the last year 65% of countries used government funds for contraceptive procurement countries included 7 out of 9 methods On average, these countries had central-level stockouts of 1- 2 products 22 countries indicated insufficient funding for contraceptive procurement 100% of committees include the Ministry of Health 91% of countries offer all five of the most commonly offered methods 85% of countries include CS in a national strategy
Finance for Procurement Sufficient financing (from all sources) is key to ensuring a reliable supply of contraceptives. Government financing indicates a government s commitment to contraceptive security It also suggests sustainability. A budget line item can help ensure that contraceptives are a priority in annual budgeting.
Finance for Procurement Indicators include: Dollar value of estimated need for contraceptives to be procured for the public sector* Existence of a government budget line item for contraceptives Amount of government funds allocated for contraceptives Government expenditures for contraceptive procurement Value of in-kind contraceptive donations for the public sector Value of Global Fund grants used for contraceptives (including condoms) Information on the existence of a funding gap
Financing Sources for Public-Sector Contraceptives Internally generated funds these funds are drawn from government revenue sources usually from various taxes, duties or fees. Other government funds Basket funds the government manages these pooled funds which originate from various sources, including donors and the government. World Bank assistance this funding, either credits or loans, can be used for general budget support, sector budget support, or earmarked interventions. Other funds include additional funds provided to the government by donors Government Financing In-Kind Donations Contraceptive supplies that donors provide to a government Global Fund Grants These grants can be used to procure condoms or other contraceptives
Finance for Procurement Was there a government budget line item for procurement of contraceptives? 66% Were government funds allocated for the procurement of contraceptives? 77% Were government funds spent for the procurement of contraceptives? 65%
Government Expenditures 65% of respondent countries indicated that their country spent government funds on contraceptive procurement in the most recent complete fiscal year Of these 28countries using government funds: 79% reported using internally generated funds 39% reportedusing other government funds The average amount of government funds spent was: $1,182,272 from internally generated funds $2,270,760 from other government funds
Government Expenditures Respondent Countries That Did Not Spend Government Funds on Contraceptive Procurement during the Previous Fiscal Year Latin America & the Caribbean Africa Europe & Asia Cameroon Guinea Liberia Malawi Mali Mauritania Niger Sierra Leone Togo Armenia Bangladesh Georgia Pakistan Russia Haiti Honduras
Government ExpendituresAfrica Internally Generated Funds as Percentage of all Government Funds Total Government Funds Spent (USD) Country Internally Generated Funds Other Government Funds Benin 100% $ 40,000 $ 40,000 Burkina Faso 100% $ 2,478,874 $ 2,478,874 Burundi 4% $ 59,519 $ 1,326,387 $ 1,385,906 Cape Verde 100% $ 28,398 $ 28,398 DR Congo 0% $ - $ 3,000,000 $ 3,000,000 Ethiopia 0% $ - $ 21,400,000 $ 21,400,000 Ghana 0% $ 1,155,195 $ 1,155,195 Kenya 63% $ 6,214,337 $ 3,672,000 $ 9,886,337 Madagascar 100% $ 45,454 $ - $ 45,454 Mozambique 0% $ - $ 2,750,000 $ 2,750,000 Nigeria 27% $ 3,000,000 $ 8,000,000 $ 11,000,000 Peru 100% $ 9,616,296 $ 9,616,296 Rwanda 100% $ 408,296 $ - $ 408,296 Senegal South Africa Tanzania 100% $ 250,000 $ 250,000 unknown unknown unknown unknown 0% $ - $ 2,500,000 $ 2,500,000 Uganda 100% $ 3,300,000 $ 3,300,000 Zambia 100% $ 1,120,000 $ 1,120,000
Government ExpendituresEurope & Asia Internally Generated Funds Other Government Funds Total Government Funds Spent (USD) Internally Generated Funds as Percentage of all Government Funds Country $ - $ 34,000,000 $ 34,000,000 unknown $ 716,919 $ 2,765,906 $ - $ 9,343,640 0% Bangladesh India Nepal Philippines Ukraine unknown unknown unknown 74% 100% 58% $ 2,048,987 $ 9,343,640 $ 160,625 $ 118,125 $ 278,750
Government ExpendituresLAC Internally Generated Funds as Percentage of all Government Funds Internally Generated Funds Other Government Funds Total Government Funds Spent (USD) Country Dominican Republic $ 1,360,000 $ - $ 1,360,000 100% El Salvador $ 1,625,000 $ 125,000 $ 1,750,000 93% Guatemala $ 2,713,756 $ - $ 2,713,756 100% Nicaragua $ 742,173 $ 712,987 $ 1,455,160 51% Paraguay $ 371,000 $ - $ 371,000 100%
Finance for Procurement Percentage of Total Spending for Public Sector Contraceptives, by Funding Source 100% 90% 80% 70% 60% 50% 40% 30% 20% 10% 0% Zambia Nigeria Philippines Honduras Benin Kenya Madagascar Mauritania Mozambique Zimbabwe Burundi Ethiopia Guinea Senegal Burkina Faso Malawi Afghanistan Bangladesh Georgia Haiti Liberia India Russia Ukraine Guatemala Nicaragua Tanzania Nepal Cape Verde DR Congo Ghana Mali Rwanda Uganda Pakistan Yemen El Salvador Peru Togo Niger South Sudan Dominican Republic Paraguay Cameroon Sierra Leone South Africa Armenia Africa Europe and Asia LAC Internally generated funds Other government funds In-kind donations Global Fund grants--condoms Global Fund grants--contraceptives besides condoms
Finance for Procurement 22 countries indicated there was insufficient funding for contraceptive procurement 16 countries covered more than 100% of the quantified need 4 countries did not know if there was a funding gap Percentage of Quantified Need Covered during the Year 1154% 125% 214% 159% 270% 121% 121% 120% 100% 80% 60% 40% 20% 0% Niger Peru Liberia Benin Burundi Malawi Nigeria Togo India South Africa Burkina Faso DR Congo Guinea Haiti Zimbabwe Afghanistan Nicaragua Madagascar Mali Mauritania Tanzania Armenia Nepal Yemen Paraguay Cape Verde Ghana Kenya Uganda Bangladesh Georgia Ukraine Dominican Republic Senegal Sierra Leone Zambia Philippines Russia Rwanda El Salvador Cameroon Ethiopia Mozambique Honduras Pakistan Guatemala South Sudan Africa Europe and Asia LAC
Finance for Procurement A budget line item alone is not enough to ensure that contraceptives will be funded, but it is usually a good indicator 29 out of 44 respondent countries reported having a government budget line item for contraceptive procurement* 79% of countries with a budget line followed up with funding for contraceptive procurement 33% of countries without a budget line funded contraceptive procurement
Policies Policies can reflect the level of government commitment to contraceptive security, as well as significantly impact client access to family planning.
Policies Indicators include: Existence of a national contraceptive security strategy Policies limiting or promoting access to family planning Inclusion of contraceptives on the National Essential Medicines List (NEML) Inclusion of CS concepts and family planning indicators in the Poverty Reduction Strategy Paper (PRSP) Which method is the lowest level provider allowed to dispense (task shifting)?
PoliciesNational Essential Medicines List Methods Offered in the Public Sector, Included in the NEML 100% Male condom 100% On average, countries include 7 out of the 9 surveyed methods on the NEML or equivalent 98% IUD 98% 98% Combined oral contraceptives 98% 96% Injectables 96% 89% CycleBeads 50% 83% Implants 83% 74% Progestin-only pills 74% 59% Female condom Listed in the NEML 61% 57% Emergency contraceptive pills Offered in the Public Sector 57%
PoliciesGovernment Strategies 40 out of 47 countries reported having a contraceptive security strategy (or another strategy that includes a CS component) Of those, 92% have been formally approved by the Ministry of Health 92% of the strategies are reportedly being implemented
PoliciesProvision and Access Taxes, duties and fees 30 out of 46 countries mentioned taxes, import duties, or fees on contraceptives primarily affecting commercial-sector goods 4 countries report advertising bans that affect the provision of private-sector contraceptives Advertising bans Policies enabling the private sector 28 out of 41 countries report policies that enable the private sector to provide contraceptive methods Restricting access to sub- populations 6 countries reported that unmarried people or youth have restrictions placed on their access to contraceptives. In 9 countries there are charges to public-sector clients for FP services. In 10 countries there are charges to public-sector clients for FP commodities. Charges
PoliciesCharges to Clients Services Commodities Cameroon Benin Democratic Republic of Congo* Burkina Faso Ghana Cameroon Guinea* Cape Verde* Haiti* Democratic Republic of Congo* Mali* Mali* Senegal* Pakistan* Togo Senegal* Zimbabwe* Togo Zimbabwe* *There are exemptions for those who are unable to pay
Commodities Providing a mix of contraceptive methods is essential to ensure that clients can choose the contraceptive that best fits their needs. 11 methods included in survey Combined oral contraceptives Progestin only pills Emergency contraceptives Male condoms Female condoms IUD Injectables Implants CycleBeads Tubal ligation Vasectomy
Commodities Indicators include: Range of contraceptives offered through: Public sector facilities Nongovernmental organization (NGO) facilities Social marketing Commercial-sector facilities
Commodities Percentage of Respondent Countries that Offer Contraceptive Methods, by Method and by Sector 100% 90% 80% 70% 60% 50% 40% 30% 20% 10% 0% Combined oral contraceptives Progestin-only pills Injectable Implant Intrauterine Device (IUD) Male condoms Female condoms Emergency contraceptive pills Vasectomy Tubal Ligation CycleBeads Private Sector Public Sector NGO Social marketing
Commodities On average, countries offer 8 out of 11 assessed methods in the public sector 11 surveyed countries offer all 11 methods: Benin, Burundi, DR Congo, Ghana, Guinea, Haiti, Kenya, Malawi, Senegal, Togo, Zimbabwe 91% of countries offer all 5 of the most commonly offered methods: male condoms combined oral contraceptives IUDs tubal ligations injectables
Coordination & Leadership For contraceptive security to be realized, stakeholders from various sectors public, NGO, social marketing and commercial must work together to promote effective and efficient service delivery and supply chain systems to ensure access to contraceptives for all segments of the population.
Coordination & Leadership Indicators include: Existence of a national committee that works on contraceptive security Organizations represented on the committee Frequency of committee meetings Legal status of the committee Existence of a contraceptive security champion
Coordination & Leadership 89% of countries have a committee that works on contraceptive security 61% of the committees have legal status Percentage of Respondent Countries' Contraceptive Security Committees that Include Specific Organizations 100% 90% 80% MOH and UN Agency on all committees 70% 60% 50% 40% 30% 20% 10% 0% Ministry of Health UN Agencies Donors Social Marketing Organizations NGOs Central Medical Store or Central Warehouse Commercial sector organizations Ministry of Finance or Ministry of Planning
Supply Chain An effective supply chain enables the continuous availability of high-quality contraceptives, which is essential to ensuring contraceptive security.
Supply Chain Indicators include: Central-level stockout data Whether stockouts are a major problem at the central level Whether stockouts are a major problem at the service delivery point (SDP) level
Supply Chain 48% (20 of 42) of responding countries reported a central-level stockout of at least one contraceptive method during the last year On average, these countries reported central-level stockouts of 1-2 products.
Supply Chain 53% of countries identified service delivery point stockouts as a large problem 14% of countries identified central-level stockouts as a large problem
Supply Chain Central Level Stockout Information, by Method 10 33 Male condom 6 37 Intrauterine Device (IUD) 12 30 Injectables 8 34 Combined oral contraceptives 11 25 Implants 4 30 Progestin-only pills 9 17 Emergency contraceptive pills 6 20 Female condom 5 14 CycleBeads 0 5 10 15 20 Number of Countries 25 30 35 40 45 50 Stockout(s) reported during the year No stockout(s) reported during the year
Conclusions Finance Policies Commodities Coordination Supply Chain What s Working On average, countries included 7 out of 9 methods on their National Essential Medicine List More than 50% of governments are using their funds for contraceptives On average, countries offer 8 out of 11 methods in the public sector 89% of Fewer than 50% of countries experienced a central level stockout countries have a committee that works on CS issues Where improvements can be made Diversify committee membership- include Ministry of Finance/ Planning and commercial sector Ensure that policies enable all sectors to offer a range of methods and all clients can access those methods. Monitor stock at all levels of the system to ensure stockouts at the central level don t result in stockouts at SDPs Increase number of countries allocating funds and following through to spend them Continue to expand range of commodities offered in all sectors.
For More Information Visit: http://deliver.jsi.com/dhome/whatwedo/commsecurity/csmeasuring/csindicators Data Maps Dashboards