Measuring Education SDGs - Conference Overview
Explore the impact of education SDGs at the Quantitative Applications in Education conference in Stellenbosch, South Africa. Learn about the research goals, numerical motivation, and insights on the value of educational information and change.

Download Presentation

Please find below an Image/Link to download the presentation.
The content on the website is provided AS IS for your information and personal use only. It may not be sold, licensed, or shared on other websites without obtaining consent from the author. If you encounter any issues during the download, it is possible that the publisher has removed the file from their server.
You are allowed to download the files provided on this website for personal or commercial use, subject to the condition that they are used lawfully. All files are the property of their respective owners.
The content on the website is provided AS IS for your information and personal use only. It may not be sold, licensed, or shared on other websites without obtaining consent from the author.
E N D
Presentation Transcript
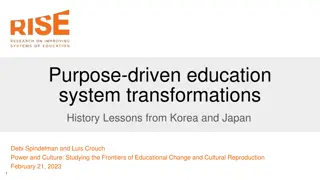
We Know the Cost: Do we Know the Value? Measuring the Education SDGs Conference on Quantitative Applications in Education 19-20 September 2016 Stellenbosch, South Africa Luis Crouch RTI International www.rti.org RTI International is a registered trademark and a trade name of Research Triangle Institute.
Scheme Background/Goals of the research Numerical Motivation The Model The Data Some Initial Results Conclusions and Caveats
Background/Goals of the research MDGs were highly motivational SDGs criticized as too many, too hard to measure Cost of measurement itself attacked (e.g., Copenhagen Consensus) We know the cost Education leaders ask: but what is the value of having information? (E.g., UNESCO Institute for Statistics). How do we motivate investing $ in having better information? Additional this question: how do we demonstrate the value of educational change itself? This research looks at both at the same time A method for calculating how much (good) information is worth How to get more value for $ out of the cost of education itself (motivates discussion with MinFin) Model is work in progress, many caveats Even after finished, heuristic
Some quantitative motivation - 1 I am getting bored and feeling trite to say: We have access, now the problem is quality (Not completely true anyway.) But even specialists not aware of just how bad the problems are, and where it starts So let me give some numerical motivation
Quantitative motivation 2 How it feels This is how most This is how most 3rd-grade kids in low-income countries read, at best 3rd-grade kids in rich countries (OECD) read Note: Comparison is actually much worse, but it is too painful to sit through!
Quantitative motivation 3: What do the most basic numbers tell us? Uganda case Enrollment Pyramid P7 P6 P5 P4 P3 P2 P1 0 200,000 400,000 600,000 800,000 1,000,000 1,200,000 1,400,000 1,600,000 1,800,000 2,000,000
Quantitative motivation 3: What do the most basic numbers tell us? Uganda case Enrollment Pyramid P7 What is the size of the job? P6 P5 P4 P3 P2 P1 0 200,000 400,000 600,000 800,000 1,000,000 1,200,000 1,400,000 1,600,000 1,800,000 2,000,000
Quantitative motivation 3: What do the most basic numbers tell us? Uganda case Enrollment Pyramid P7 What is the size of the job? P6 This big? P5 P4 P3 P2 P1 0 200,000 400,000 600,000 800,000 1,000,000 1,200,000 1,400,000 1,600,000 1,800,000 2,000,000
Quantitative motivation 3: What do the most basic numbers tell us? Uganda case Enrollment Pyramid What happens if we overlay the population? P7 P6 P5 P4 P3 P2 P1 0 200,000 400,000 600,000 800,000 1,000,000 1,200,000 1,400,000 1,600,000 1,800,000 2,000,000
Quantitative motivation 3: What do the most basic numbers tell us? Uganda case Enrollment with Population Overlay P7 What do we notice? Compare population and enrollment carefully. P6 P5 P4 P3 P2 P1 0 200,000 400,000 600,000 800,000 1,000,000 1,200,000 1,400,000 1,600,000 1,800,000 2,000,000 Population of Appropriate Age Enrollment
Quantitative motivation 3: What do the most basic numbers tell us? Uganda case Enrollment with Population Overlay P7 This small? What is the size of the job now? P6 P5 P4 P3 P2 P1 0 200,000 400,000 600,000 800,000 1,000,000 1,200,000 1,400,000 1,600,000 1,800,000 2,000,000 Population of Appropriate Age Enrollment
Quantitative Motivation 3 The same problem in many countries Age for Grade and the Early Grades Bulge This means that systems have to deploy an enormous amount of enrollment effort to produce one grade 6 completer. 2.75 2.5 2.25 Enrollment Grade for Age 2 1.75 1.5 1.25 1 0.75 0.5 0.25
Quantitative Motivation 4 Aging at school Data from IDS Sussex s (Keith Lewin) CREATE project, Uganda, enrollment by age and grade Look at the peak for grade 1: Very peaked and right at 6 (green dotted lines) Then by the time you get to grade 3, the peak is for age 9, and curve is much flatter (non-peaked) It is the system that is over-aging the kids, not late enrollment, sometimes by 1.5 years in Grade 1!! 13
Quantitative motivation 5 Some evidence on how to improve Evidence seems to be piling up. My read of selected well evaluated literature (not systematic, but sampling some 70 papers from WB, and various NGO implementers). Type of intervention Median Effect Size 1st Quartile Effect Size 3rd Quartile Effect Size Accountability (governance, market incentives, community voice, etc.) and pure inputs( traditional teacher training, more books )* Pedagogical* .17 .13 .22 .33 .15 .61 *Notes: Not at scale, but neither are accountability experiments. Pedagogical: mostly triple cocktail (Brahm Fleisch) of scripted lesson plans, aligned texts and instructional materials, and coaching for teachers I would add appropriate but un-ashamed measurement
Quantitative Motivation - Summary The quality situation is much worse than normally thought by most Ministers, and international agencies The problem is in the Foundations Shows up as huge enrollment effort per completer: 14 or so student- years per primary completer in Uganda Shows up in radical inability to master, on time, even the most simple and foundational skills such as reading decoding and fluency In low-income areas, 25% to 75% of end-of-2nd grade kids cannot read a single word Other correlates: low preparedness (little or low-quality ECD) permanently high but fictional intake rate real repetition much higher than reported repetition (may be 2 or 3 X) kids aging at school , not (necessarily) enrolling late
The model - 1 Ask two questions: 1. What is the difference in social profit provided by an education system that uses best practices based on best-available-knowledge 2. How sensitive is the social profit provided by a system to various asssumptions? Cast as a linear optimization model Maximize the social profit produced by a business as usual system Maximize the social profit produced by a best practice system Compare the difference The two problems are characterized by different Prices Pedagogical constraints and relationships Internal efficiency concerns (e.g., how many enrollees it takes to produce one completer)
The model - 2 3 3 ? 3 3 ? ? = max ?? ?? ??,? ?=1 ?=1 ?,???,? max ???? ??,???,? ?=1 ?=1 ?=1 ?=1 The primes ' on all the symbols characterize best practice , un-primed is business as usual. y = income per completer for level l* C = completers for level l p = prices of inputs i for level l X = usage of inputs i for level l Only 3 levels (pre-primary, primary, lower secondary, for reasons noted) Each maximization is subject to its own constraints, as follows. A key one characterizes the effort, in Enrollment (E) that the system must make to produce completers C. (Notation is a bit weird in traditional LP notation. ?? ????= 0 for ? = 1,2, ?? ??= 0 for ? = 0,thus ??= 1 *Actually, PDV of incremental income over no education so as to bring the income forward in time to when the expenditure is taking place
The model - 3 Enrollment in one level is characterized by efficient or inefficient flow between levels. This is also a key driver of cost per completer. ?1= ?1?1?5, ?2= ?2(?2?6+ ?1 2?1), ?3= ?3?3?1, There is a budget constraint (otherwise the system might be unbounded). 3 ? ??,???,? ?=1 ?=1 ? Many simple equations of the following form characterize the relationship between enrollment and also amongst the inputs. E.g., to characterize a system that uses the triple cocktail (hence best practice ) versus one that does not. ??,? ??,???= 0,
The data - 1 Characterize a business as usual model More or less a typical case in point, using for now Uganda as approximate reference point Characterize a best practice (reasonable best practice for a developing country not anchoring on Finland or Korea!) case Large scale pilots from international agencies, NGOs, or government s own best case experiments, if successful Better practice cases at scale, implemented by countries, e.g., Thailand Macro benchmarks such as Fast Track Initiative for improving systems Not drawing formal averages or means for impacts just a heuristic sense of impact and technical profile Using some international comparative evidence from the literature (e.g., impact on GDP per capita of learning outcomes)
The data - 2 Concept Best (reasonable) practice Practice as usual Entry into pre-primary 1 0.3 1 Transition from last year pre-primary to primary 1 1 Transition from population to primary 0.7 0.14 Primary completers / primary students 0.07 Primary dropouts/student 0.35 0.05 LS transitioners / primary completers 0.20 1.0 LS completers / student 0.20 0.25 LS dropouts / student 0.3 0.1 20 Pupil/teacher ratio pre-primary 40 40 Pupil/teacher ratio primary 45 40 Pupil/teacher ratio LS 40 10 Ratio pre-prim teachers / coaches 100 ( no coaching) 10 Ratio prim teachers / coaches 100 ( no coaching) 10 Ratio JS teachers / coaches 100 ( no coaching) 5 Ratio of "books" per student, pre-primary 0.1 ( no books) 5 Ratio of "books" per student, primary 0.1 ( no books) 5 Ratio of "books" per student, LS 0.1 ( no books) 1 ( no systems improvement exp.) 10 Per pupil expenditure ($) on systems improvements
The data - 3 Concept Best (reasonable) practice Practice as usual 1 4 Cost ($) / book (inst. materials in general) 3.3 Teacher salary / GDP per capita, pre-prim 2.0 3.3 Teacher salary / GDP per capita, prim 4.5 4.5 Teacher salary / GDP per capita, JS 6.0 7.0 Coach salary / GDP per capita, pre-prim 2.0 7.0 Coach salary / GDP per capita, prim 4.5 10.0 Coach salary / GDP per capita, JS 6.0 1.0 Wage premium / GDP per capita, some primary 1.1 1.5 Wage premium / GDP per capita, primary 1.4 1.8 Wage premium / GDP per capita, some LS 1.6 2.1 Wage premium / GDP per capita, LS 1.75
Results Best practice Standard practice Concept Difference % diff Comment Revenue (US$ Bn) 4.3 3.0 1.3 44% Cost (US$ Bn) 3.7 2.6 1.0 40% "Return" (Not Mincerian RoR) 16% 12% 3.7 pct points or 30% Net revenue (US$ Bn) 0.6 0.3 0.3 Value of information or of best practice? Cost/Student (US$) 208 174 34 20% Primary cost/primary completer (US$) 1357 2459 -1101 -45% Note the difference between cost per student and cost per completer
Conclusions and caveats Interesting way to look at both value of information? And what determines the social return to education? ( Best practice = triple cocktail, more books, better prices for books, etc.) Strong caveats Heuristic only. Not econometrically estimated (This can be improved). Biggest caveat: value of information, or value of ability to act on the information? Only an upper limit on the value of being informed The real value is a political reality.
More Information Luis Crouch VP and CTO International Development Group RTI International +1 202 728 2058 lcrouch@rti.org