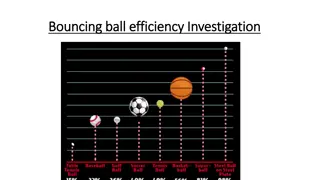
Measuring Efficiency at Local Government Level: Research Findings and Methodology
Discover the DEA and SFA methodologies used to measure efficiency at the local government level, along with detailed research findings and second-stage analysis. Explore DEA efficiency scores, SFA efficiency scores, size classifications, and kernel estimation of explanatory variables on efficiency scores.

Download Presentation

Please find below an Image/Link to download the presentation.
The content on the website is provided AS IS for your information and personal use only. It may not be sold, licensed, or shared on other websites without obtaining consent from the author. If you encounter any issues during the download, it is possible that the publisher has removed the file from their server.
You are allowed to download the files provided on this website for personal or commercial use, subject to the condition that they are used lawfully. All files are the property of their respective owners.
The content on the website is provided AS IS for your information and personal use only. It may not be sold, licensed, or shared on other websites without obtaining consent from the author.
E N D
Presentation Transcript
Measuring efficiency at local government level Marjan Nikolov
VARIABLES FIRST STAGE: DEA-VRS ESTIMATION Ministry of Finance, 2010 excel database received from the Treasury Department INPUT VARIABLES Current expenditures OUTPUT VARIABLES Population - ages 0-4 Population - ages 5-19 Population - ages 20 to 64 Population ages over 65 Length of asphalt-equivalent roads (kilometers) State Statistical Office (SSO), 2010 estimates of population 2009 for length of roads
Research methodology - DEA Non-parametric DEA AE= OR / OQ TE = OQ / OP x2 y S P Q R Q1 S x 1 y O
Research methodology - SFA Parametric SFA 5 = + + + ln( C ) ln( OUT ) ( V U ) i i i i 0 1 5 = = + + U iz w i i i 0 i 1
Findings DEA efficiency scores SFA efficiency scores Size class 0.573 All sizes POP < 5,000 0.596 0.585 0.502 0.585 0.831 5,000 POP < 10,000 0.720 0.810 10,000 POP < 15,000 0.614 0.720 15,000 POP < 20,000 0.551 0.400 20,000 POP < 60,000 0.345 0.218 POP 60,000
Research findings SECOND STAGE SECOND STAGE- -KERNEL Kernel Fit (Normal, h = 0.0978) KERNEL Kernel Fit (Normal, h = 529.30) Kernel Fit (Normal, h = 26.248) DEA scores 1.0 DEA scores 1.0 1.0 DEA scores 0.8 0.8 0.8 0.6 0.6 0.6 DEA DEA DEA 0.4 0.4 0.4 0.2 0.2 0.2 0.0 0.0 0.0 0.0 0.2 0.4 0.6 0.8 0 1000 2000 3000 4000 0 50 100 150 200 ETF OWNTAX DENSITY Figure. Kernel estimation of the explanatory variables on DEA-VRS efficiency scores