Measuring Socio-Mathematical Agency Through Student Surveys
Explore how primary school teachers can enhance social justice education by developing students' socio-mathematical agency through a quantitative survey method. The project involves measuring students' sense of agency in social change through mathematics and evaluating the impact of collaborative problem-solving in a classroom setting.
Uploaded on | 1 Views
Download Presentation

Please find below an Image/Link to download the presentation.
The content on the website is provided AS IS for your information and personal use only. It may not be sold, licensed, or shared on other websites without obtaining consent from the author. If you encounter any issues during the download, it is possible that the publisher has removed the file from their server.
You are allowed to download the files provided on this website for personal or commercial use, subject to the condition that they are used lawfully. All files are the property of their respective owners.
The content on the website is provided AS IS for your information and personal use only. It may not be sold, licensed, or shared on other websites without obtaining consent from the author.
E N D
Presentation Transcript
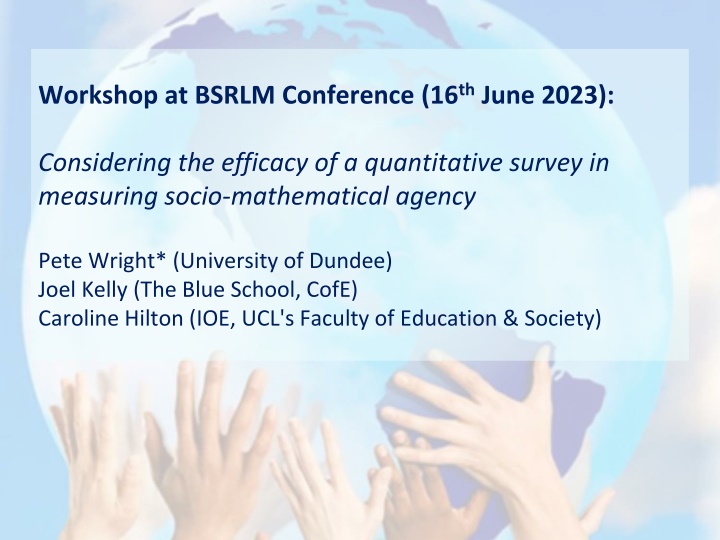
Workshop at BSRLM Conference (16thJune 2023): Considering the efficacy of a quantitative survey in measuring socio-mathematical agency Pete Wright* (University of Dundee) Joel Kelly (The Blue School, CofE) Caroline Hilton (IOE, UCL's Faculty of Education & Society)
Brief overview of the PMSJ project Research questions: How can primary school teachers maintain and build upon their initial interest in addressing social justice issues through their teaching of mathematics? How can primary school teachers help students develop their socio- mathematical agency ? (Wright, 2022) Methodology/methods: Adopted a model of PAR (Wright, 2021; Wright, et al., 2022). Research team: 3 lead researchers, 6 teacher researchers in 2 London primary schools between Nov 2021 and Jul 2022. 5 research team meetings discuss theory; agree research design/data collection methods; plan/evaluate 2 research lessons. Interviews with TRs at start/end thematic analysis of data from interviews and evaluative discussions during meetings [focus at BSRLM Mar23 see Wright, Hilton & Kelly (2023)]. Self-reporting survey administered twice to all students in 6 classes taught by TRs, near the beginning (before first research lessons) and end of the project designed to measure students sense of socio-mathematical agency (SMA).
The student survey Socio-mathematical agency (SMA): The ability to use mathematics effectively to argue collectively for social change. Three components of (sense of) SMA: 1. Appreciate the links/applications between mathematics and social justice issues. 2. Appreciate the power of mathematics to support an argument for social change. 3. Appreciate the value of working together in mathematics to solve problems. Key features of the survey: Surveys considered more appropriate to measure sense of agency rather than agentic behaviour (see Manyukhina & Wyse, 2019). Students invited to rank (on a 4-point Likert scale) extent to which they agreed with statements relating to SMA, and give a comment to explain each ranking. Particular consideration given to language to ensure accessible to students from Year 1 to 6 (ages 5 to 11) piloted with Year 2 students not involved in project. TR (or another staff member known to students) assisted Year 1 and 2 students in completing survey by reading statements and scribing responses. The same survey was administered at the start and end of project unique identifiers were used to match students responses.
The six survey statements Socio-mathematical agency (SMA): The ability to use mathematics effectively to argue collectively for social change. Three components of (sense of) SMA: 1. Appreciate the links/applications between mathematics and social justice issues. 2. Appreciate the power of mathematics to support an argument for social change. 3. Appreciate the value of working together in mathematics to solve problems. The six statements (see survey handout for how these were presented): 1. Maths helps people to understand the world better. 2. It is good to solve maths problems with other people. (component 3) 3. Maths can be used to make the world a better place. (component 2) 4. You can do more in maths when you work with others.(component 3) 5. Maths can be used to mislead people. 6. You can use maths to help you explain something. (component 1) (component 1) (component 2)
Questions to prompt discussion in workshop: Questions relating to SMA and the PMSJ project: To what extent does the survey provide a valid and reliable measure of SMA? To what extent can the use of the survey generate better understanding of SMA? Broader questions: To what extent can quantitative surveys be used as a valid and reliable measure of theoretical concepts? To what extent can quantitative surveys be used to generate better understanding of theoretical concepts?
Some examples from the statistical analyses: 1) We* looked for a correlation between the rankings and explanatory comments for each statement. 2) We* looked for correlations between rankings of different statements, particularly those relating to the same component of SMA. 3) We* looked for correlations and differences between rankings for each statement across the two surveys. Notes: *Most of the analysis was completed by Pete with support from Caroline and comment from Joel. We ll look at each example in turn (we might not get time for all three). Please do not take any data sheets away with you (for ethical reasons). More details of the statistical analyses can be found in the PMSJ Project report.
Example 1: 1) We looked for a correlation between the rankings and explanatory comments for each statement: The aim was to test for criterion validity . See Handout 1 for selected findings. We looked at comments only and predicted what we thought rankings would be. We chose Aidan s Year 2 class due to the relatively high proportion of comments. We also noticed this class appeared to have a noticeable increase in rankings. Note that this class had a relatively high proportion of bilingual learners aged 6-7. Some rankings had no accompanying comments (so were ignored). Some comments suggested student had misunderstood the statement (coded M). Some comments did not allow us to make any predictions, e.g. simply re-phrased the statement or expressed a level of confidence in the response (coded X). The number of predictions possible are summarised in Tables 1 and 2. We tested for correlation, using Spearman s Correlation Coefficient, between actual rankings and predicted rankings on both surveys combined. See Table 3. Table 4 includes some of the student data from Survey 2.
Example 2: 2) We looked for correlations between rankings of different statements, particularly those relating to the same component of SMA: The aim was to test for internal reliability . See Handout 2 for selected findings. We used the Spearman s Correlation Coefficient (Spearman s Rho) to test for correlations between students rankings for each pair of statements. In each test we used only those students who ranked both statements. We report the findings for Survey 2 only (see Table 1), as we feel students were more likely to have a better developed sense of SMA at that point. If the survey was reliable, we would expect to see positive correlations between all pairs of statements and the strongest correlations between statements related to the same components of SMA (1&5, 3&6, 2&4).
Example 3: 3) We looked for differences between rankings for each statement across the two surveys: The aim was to explore whether there was any significant increase in students SMA over the course of the project. See Handout 3 for selected findings. We used the Wilcoxon Matched-Pairs Signed-Rank Test to look for significant differences between students rankings of statements across the two surveys. First we compared the rankings on each question for all students who had completed both surveys (see Table 1). Then we looked at students in each class as we felt the teacher was likely to be a significant factor in any increase in students SMA. We report the findings from the comparisons of the rankings on each question for students in Aidan s Year 2 class (see Table 2). We present (in Table 3) examples of comments made by students in Aidan s class to explain their rankings on statements (comparing Survey 1 and 2 responses).
References Manyukhina, Y. & Wyse, D., 2019. Learner agency and the curriculum: A critical realist perspective. The Curriculum Journal, 30(3), pp. 223-243. Wright, P., 2021. Transforming mathematics classroom practice through participatory action research. Journal of Mathematics Teacher Education, 24(2), pp. 155-177. Link Wright, P., 2022. Conceptualising and operationalising socio-mathematical agency. Proceedings of the 12th Congress of the European Society for Research in Mathematics Education. Bolzano, Italy, CERME. Link Wright, P., Carvalho, T. & Fejzo, A., 2022. Visible mathematics pedagogy: A model for transforming classroom practice. Educational Action Research, 30(2), pp. 168-191. Link Wright, P., Hilton, C. & Kelly, J., 2023. Primary school teachers tackling social justice issues whilst teaching mathematics: Findings from the Primary Maths & Social Justice research project. Proceedings of the BSRLM Conference (March 2023). UCL IOE, London, BSRLM. Link
Primary Maths & Social Justice webpage Download the ppt and find out more about the project at: https://mathsocialjustice.org/research/

