Medicare Managed Care vs. Traditional Medicare: Cancer Drug Cost Comparison
Explore a study by Cathy Bradley, PhD, MPA, investigating if Medicare Managed Care prescribes lower-cost cancer drugs compared to Traditional Medicare. Learn about the high costs of cancer drugs in the U.S., the coverage and spending on drugs in Traditional Medicare, and the implications for patients. Discover the research question, results, interpretations, limitations, and future steps related to this important healthcare topic.

Download Presentation

Please find below an Image/Link to download the presentation.
The content on the website is provided AS IS for your information and personal use only. It may not be sold, licensed, or shared on other websites without obtaining consent from the author. If you encounter any issues during the download, it is possible that the publisher has removed the file from their server.
You are allowed to download the files provided on this website for personal or commercial use, subject to the condition that they are used lawfully. All files are the property of their respective owners.
The content on the website is provided AS IS for your information and personal use only. It may not be sold, licensed, or shared on other websites without obtaining consent from the author.
E N D
Presentation Transcript
Does Medicare Managed Care Prescribe Lower Cost Cancer Drugs than Traditional Medicare? Cathy Bradley, PhD, MPA Supported by a grant from the National Cancer Institute Addressing Urban-Rural Disparities in Cancer: The Case for Registry Expansion (R01CA229551, Bradley and Perraillon, Principal Investigators)
Team Cathy Bradley Sara Kitchen Faye Liang Rich Lindrooth Marcelo Perraillon Lindsay Sabik Colorado Central Cancer Registry, John Arend and Kieu Vu Colorado Institute for Value in Health Care
Research Question: Does Medicare MC prescribe lower cost drugs for cancer treatment than TM? Today s Talk Cost of cancer care in the U.S. Brief overview of Medicare Previous research Study from Colorado Data Sample Results and interpretation Conclusions Limitations Future steps
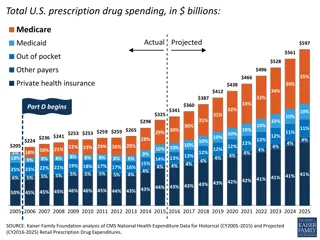
High Costs of Drugs in the U.S. Between 2017-2021, 69% of new cancer drugs in the U.S. cost more than $100,000 per year1 32% of new cancer drugs exceeded $200,000 per year1
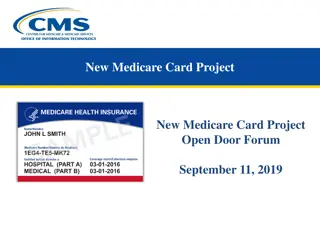
Traditional Medicare People 65+; certain people <65 with a long-term disability Traditional Medicare (TM) Part A inpatient hospital stays, skilled nursing facilities, home health visits, hospice2 Part B physician visits (including physician administered medications), outpatient services2 Part D outpatient prescription drugs2
Traditional Medicare Drug Coverage Spending on Medicare Part B drugs (physician-administered injections/infusions) grew 9.6% annually between 2009-20173 Burden on Medicare Burden on enrollees; those without supplementary coverage are responsible for 20% co-insurance4 (~90% have supplementary coverage)3 Spending in Medicare Part D ~50% of cancer drugs are oral and fall under Medicare Part D5 Currently, no limit on out-of-pocket (OOP) spending on Part D drugs, which can lead to high costs for enrollees5 The Inflation Reduction Act limited OOP spending on Part D drugs at $3,250 for 2024 and $2,000 for 20256
Medicare Advantage Patients incur significant costs if they go out of network Requires prior authorization for high- cost procedures Promotes care coordination to avoid excessive utilization Employs financial incentives to influence physicians prescribing patterns
Medicare Advantage 50% of Medicare enrollees nationwide that are enrolled MA7 52% of Colorado Medicare enrollees enrolled in MA8 General characteristics of enrollees9 More likely to be Black or Latino Lower-income Urban Similar number of chronic health conditions compared to TM10 Restrict enrollees choice of providers by establishing limited networks
Medicare plan differences - Summary Traditional Fee-For-Service Medicare (TM) Free to choose physicians Physicians are paid based on services provided Encourages physicians to prescribe more expensive drugs Medicare Advantage (MA) Designed to reduce costs Pays a capitated monthly amount Usually care is designated to in-network hospitals and clinicians Focuses on prevention Beneficiaries choose between TM and MA.
Evidence suggests MA prescribes lower cost drugs Prescribing patterns between TM & MA for different medical scenarios5 anti-VEGF agents to treat macular degeneration bone resorption inhibitors for osteoporosis bone resorption inhibitors for malignant neoplasms intravenous iron for iron deficiency anemia Enrollees in MA were more likely to be prescribed less expensive Part B drugs than TM when there is an equally effective alternative5 If TM followed prescribing patterns of MA, there could be a 6%-20% savings across these 4 scenarios
Further evidence TM and MA prescribing for type 2 diabetes11 Medication choices by TM were generally costlier and had greater use of new classes of medication TM had a slightly lower prescription rate of metformin as the initial treatment MA had lower costs to the patient and the plan, even among patients using the same number of medications 2 Meta-analyses had similar findings12,13
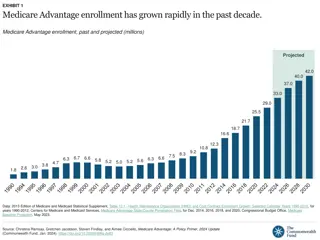
Limitations of prior studies Quality of MA encounter data Generalizability. Since the enactment of the ACA, enrollment in MA has grown rapidly Omitted variables patient health and risk adjustment Failure to adequately control for selection into plans
Evidence from Colorado Does MC prescribe lower cost drugs for cancer treatment than TM?
Data Data sources Colorado All Payer Claims Data (APCD) Colorado Central Cancer Registries (CCCR) 93% linkage rate for 2012-2017 (Match*Pro) Adults 21+ diagnosed with cancer from CCCR linked to APCD APCD data on treatment and insurance status were highly reliable Number of claims for TM and MA roughly equivalent
Sample First primary colorectal or non-small cell lung cancer Colorectal cancer may be more responsive to treatment (early stage) Continuously enrolled in TM or MA and had prescription drug coverage in the linked CCCR-APCD Stratified by site & curative & metastatic Colorectal Curative (N=1207) and metastatic (N=231) Lung Curative (N=877) and metastatic (N=579)
Rationale for sample selection Common cancers 1st (NSCLC) and 3rd (CRC) leading causes of cancer death Low-cost options available for 1st line therapy 5FU, platinum-based therapies High-cost options approved in recent years for 2nd and 3rd line therapy Curative/metastatic stratification rationale Conventional low-cost therapy less risky High-cost therapies may be the only choice
What is high-cost? Used NCCN guidelines to determine treatment options Collected cost data for all drugs Based on the distribution, >$5,000 colorectal cancer and >$4,000 for lung cancer Tested different thresholds ($6500, $9000, $12500)
Endogeneity Beneficiaries choose plan Instrumental variables Did not find a good instrument Inverse probability weighting adjustment Roughly matched the distribution, but Small sample size (getting more data) Perfect prediction for NSCLC metastatic Matching and then estimated logistic regression Difference by urban/rural residence and race/ethnicity Higher proportion of urban residents in MA Higher proportion of NHW in TM TM patients were generally older, more comorbid conditions, NHW, more urban dwellers
Matching Matching estimator with Malahanobis as the distance metric (nearest neighbor) Exact matching on rural and comorbid condition category; at least 1 match per person with replacement Effects are Average Treatment Effects (ATE) with robust standard errors Advantage: nonparametric, no functional form assumptions Other covariates used in the matching: age, race/ethnicity, marital status, comorbidity, year of diagnosis
Logistic estimation High-cost medication Colorectal Cancer with $5,000 threshold Curative Metastatic Unmatched (N=1,207) Matched with IPW (N=1,207) Matched with NN (N=1,207) Unmatched (N=231) Matched with IPW (N=231) Matched with NN1(N=231) 0.01 (0.02) 0.002 (0.02) 0.007 (0.03) 0.07 (0.06) 0.06 (0.05) 0.06 (0.08) Non-small Cell Lung Cancer with $4,000 threshold Curative Metastatic Matched with IPW2(N=874) Matched with NN (N=877) Unmatched (N=579) Matched with IPW (N=579) Matched with NN (N=579) Unmatched (N=877) 0.06 (0.03)* 0.05 (0.03)* 0.05 (0.04) 0.05 (0.04) 0.05 (0.04) 0.04 (0.05) Statistical significance **p<0.05, *p<0.10. Only statistically significant effects observed curative non-small cell lung cancer drugs with MA 5-6 ppt more likely to prescribe high-cost drugs.
Estimation CRC high-cost medication Notes: TM, traditional Medicare; MA, Medicare Advantage; CCCR, Colorado Central Cancer Registry; APCD, All Payer Claims Database. Estimated predicted margins from logistic regression using pre-matching data
Estimation NSCLC high-cost medication TM, traditional Medicare; MA, Medicare Advantage; CCCR, Colorado Central Cancer Registry; APCD, All Payer Claims Database. Estimated predicted margins from logistic regression using pre-matching dataare shown in the figures
Interpretation Suggestive evidence MC more likely to surpass $5,000 threshold for curative NSCLC Curative cancer has a good chance of responding to low-cost drugs Using greater thresholds, managed care patients more likely to receive high-cost drugs but not statistically significant MC and TM use similar treatment approaches when good alternatives do not exist
Sensitivity analysis urban only Colorectal Cancer with $5,000 threshold Curative Metastatic Unmatched (N=1,014) Matched with IPW (N=1,007) Matched with NN (N=1,014) Unmatched (N=198) Matched with IPW (N=194) Matched with NN1(N=198) 0.01 (0.03) -0.002 (0.03) -0.007 (0.03) 0.05 (0.07) 0.06 (0.05) 0.03 (0.09) Non-small Cell Lung Cancer with $4,000 threshold Curative Metastatic Matched with IPW2(N=748) Matched with NN (N=749) Unmatched (N=486) Matched with IPW (N=486) Matched with NN (N=486) Unmatched (N=749) 0.04 (0.03) 0.03 (0.03) 0.03 (0.04) 0.05 (0.045 0.05 (0.05) 0.03 (0.06) No statistically significant differences; threshold analyses show MA tendency to prescribe higher cost drugs for metastatic NSCLC
Conclusions Few TM plans in rural areas Effect size is relatively small but could have a large impact on costs, including OOP costs for patients No evidence that MA prescribes lower cost drugs for CRC and NSCLC Lower price of drugs needed
Limitations Single state where MA penetration is relatively low Have not examined spending differences May spend more on other services Have not examined CRC disease progression or mortality differences between MA and FFS Did not adequately control for endogeneity
Future steps Compare treatment regiments Mortality Add breast cancer Add more data! 2012-2022
THANK YOU Cathy J. Bradley, PhD, MPA cathy.bradley@cuanschutz.edu
References IQVIA. Global Oncology Trends 2022. Accessed June 27, 2022. https://www.iqvia.com/insights/the-iqvia-institute/reports/global-oncology-trends-2022 1. 2. Kaiser Family Foundation. An Overview of Medicare. Accessed June 29, 2022. https://www.kff.org/medicare/issue-brief/an-overview-of-medicare/ 3. Anderson KE, Polsky D, Dy S, Sen AP. Prescribing of low- versus high-cost Part B drugs in Medicare Advantage and traditional Medicare. Health Serv Res. Jun 2022;57(3):537-547. doi:10.1111/1475-6773.13912 4. Hung A, Stuart B, Harris I. The effect of Medicare Advantage enrollment on mammographic screening. Am J Manag Care. Feb 1 2016;22(2):e53-9. 5. Dusetzina SB. Your Money or Your Life The High Cost of Cancer Drugs under Medicare Part D. New England Journal of Medicine. 2022;386(23):2164-2167. doi:10.1056/NEJMp2202726 6. Kaiser Family Foundation. Explaining the Prescription Drug Provisions in the Inflation Reducation Act. Accessed June 28, 2023. https://www.kff.org/medicare/issue-brief/explaining-the- prescription-drug-provisions-in-the-inflation-reduction- act/#:~:text=The%20Inflation%20Reduction%20Act%20amends%20the%20design%20of%20the%20Part,at%20approximately%20%243%2C250%20that%20year. 7. Kaiser Family Foundation. Half of All Eligible Medicare Beneficiaries Are Now Enrolled in Private Medicare Advantage Plans. Accessed June 28, 2023. https://www.kff.org/policy-watch/half-of- all-eligible-medicare-beneficiaries-are-now-enrolled-in-private-medicare-advantage-plans/ 8. Kaiser Family Foundation. Medicare Advantage in 2022: Enrollment Update and Key Trends. Accessed April 27, 2023. https://www.kff.org/medicare/issue-brief/medicare-advantage-in-2022- enrollment-update-and-key-trends/ 9. Murphy-Barron C, Pyenson B, Ferro C, Emery M. Comparing the Demographics of Enrollees in Medicare Advantage and Fee-For-Service Medicare Better Medicare Alliance. Accessed June 28, 2023. https://bettermedicarealliance.org/publication/comparing-the-demographics-of-enrollees-in-medicare-advantage-and-fee-for-service-medicare/ 10. Schwartz AY. Who Is Medicare Advantage? A Deeper Look At Medicare Advantage Beneficiary Demographics And Trends. Accessed June 28, 2023. https://www.healthaffairs.org/sponsored- content/value-of-medicare-advantage-7 11. Landon BE, Zaslavsky AM, Souza J, Ayanian JZ. Use of diabetes medications in traditional Medicare and Medicare Advantage. Am J Manag Care. Mar 1 2021;27(3):e80-e88. doi:10.37765/ajmc.2021.88602 12. Agarwal R, Connolly J, Gupta S, Navathe AS. Comparing Medicare Advantage and Traditional Medicare: A Systematic Review . Health Affairs (Project Hope). 2021;40(6):937 944. 13. DuGoff E, Tabak R, Diduch T, Garth V. Quality, health, and spending in Medicare Advantage and traditional Medicare. Am J Manag Care. 2021 Sep;27(9):395-400. doi: 10.37765/ajmc.2021.88641. PMID: 34533909.