Explore the trends in Medicare Part D stand-alone prescription drug plans from 2006 to 2014, including changes in plan numbers, premiums, regional distribution, and enrollment. Gain insights into average premiums, premium changes, and plans with the highest enrollments to make informed decisions regarding Medicare Part D coverage.
Please find below an Image/Link to download the presentation.
The content on the website is provided AS IS for your information and personal use only. It may not be sold, licensed, or shared on other websites without obtaining consent from the author. If you encounter any issues during the download, it is possible that the publisher has removed the file from their server.
You are allowed to download the files provided on this website for personal or commercial use, subject to the condition that they are used lawfully. All files are the property of their respective owners.
The content on the website is provided AS IS for your information and personal use only. It may not be sold, licensed, or shared on other websites without obtaining consent from the author.
E N D
Presentation Transcript
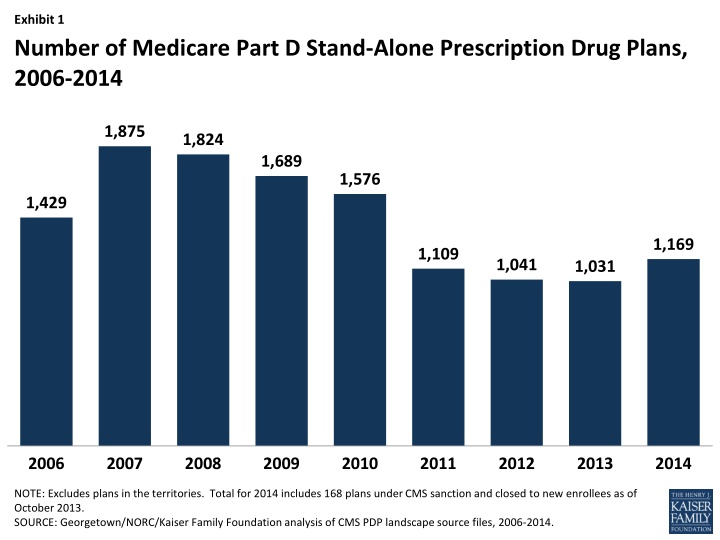
Exhibit 1 Number of Medicare Part D Stand-Alone Prescription Drug Plans, 2006-2014 1,875 1,824 1,689 1,576 1,429 1,169 1,109 1,041 1,031 2006 2007 2008 2009 2010 2011 2012 2013 2014 NOTE: Excludes plans in the territories. Total for 2014 includes 168 plans under CMS sanction and closed to new enrollees as of October 2013. SOURCE: Georgetown/NORC/Kaiser Family Foundation analysis of CMS PDP landscape source files, 2006-2014.
Exhibit 2 Number of Medicare Part D Stand-Alone Prescription Drug Plans, by Region, 2014 National Average: 35 PDPs 32 ME, NH 35 OR, WA 33 CT, MA, RI, VT 34 31 33 IA, MN, MT, NE, ND, SD, WY 36 34 NJ 37 ID, UT 39 PA, WV 37 34 38 36 35 IN, KY 35 34 DE, DC, MD 36 33 35 34 35 AL, TN 35 36 34 34 36 33 34 33 28 36 35 29 28-33 drug plans (9 regions) 34 drug plans (8 regions) 35 drug plans (7 regions) 36-39 drug plans (10 regions) NOTE: PDP is prescription drug plan. Excludes plans in the territories. Includes 168 plans under CMS sanction and closed to new enrollees as of October 2013. SOURCE: Georgetown/NORC/Kaiser Family Foundation analysis of CMS PDP landscape source file, 2014.
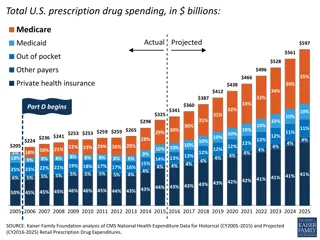
Exhibit 3 Weighted Average Monthly Premiums for Medicare Part D Stand-Alone Prescription Drug Plans, 2006-2014 Projected $45 $39.90 $37.25$38.29$37.57 $38.14 $40 $35.09 $35 $29.89 2013-2014: 5% projected increase $25.93$27.39 $30 $25 $20 2006-2014: 54% increase $15 $10 $5 $0 2006 2007 2008 2009 2010 2011 2012 2013 2014 NOTE: Average premiums are weighted by enrollment in each year. Excludes plans in the territories. Estimate for 2014 includes premiums for 168 plans under CMS sanction and closed to new enrollees as of October 2013. SOURCE: Georgetown/NORC/Kaiser Family Foundation analysis of CMS PDP enrollment and landscape files, 2006-2014.
Exhibit 4 Distribution of Changes in Monthly Premium Amounts for Medicare Part D Stand-Alone Prescription Drug Plan Enrollees If Enrollees Do Not Switch Plans Between 2013 and 2014 Decrease of $10 or more 4% Increase of more than $10 14% $1 to $10 decrease 31% $1 to $10 increase 44% Minimal change 7% NOTE: Minimal change represents premium changes of no more or less than a $1 increase or decrease. Analysis includes 168 plans under CMS sanction and closed to new enrollees as of October 2013. SOURCE: Georgetown/NORC/Kaiser Family Foundation analysis of CMS PDP enrollment, crosswalk, and landscape files, 2014.
Exhibit 5 Premiums in Medicare Part D Stand-Alone Prescription Drug Plans with Highest 2013 Enrollment, 2006-2014 2013 Enrollment (of 18.2 million) Weighted Average Monthly Premium1 First year plan offered % Change Name of PDP in 2014 % of Total First year 2013- 2014 First year- 2014 Number 2013 2014 AARP MedicareRx Preferred 2006 3,830,000 21.0% $26.31 $40.45 $43.41 +7% +65% SilverScript Basic2 2006 2,868,000 15.8% $30.94 $33.05 $29.43 -11% -5% Humana Preferred 2011 1,817,000 10.0% $14.80 $18.50 $22.72 +23% +54% Humana Enhanced 2006 1,297,000 7.1% $14.73 $43.73 $47.53 +9% +223% AARP MedicareRx Saver Plus 2013 723,000 4.0% -- $15.00 $23.22 +55% -- First Health Value Plus 2012 721,000 4.0% $25.44 $29.47 $44.58 +51% +75% First Health Essentials 2006 704,000 3.9% $24.98 $37.26 $50.80 +36% +103% Cigna Medicare Rx Secure 2006 684,000 3.8% $35.05 $35.69 $30.85 -14% -12% WellCare Classic 2007 634,000 3.5% $15.80 $33.39 $20.72 -38% +31% NOTE: PDP is prescription drug plan. Some PDPs listed here have undergone name changes since the first year the plan was offered that are not shown here. 1Average premiums are weighted by enrollment in each region for each year. 2Plan is under CMS sanction and closed to new enrollees as of October 2013. SOURCE: Georgetown/NORC/Kaiser Family Foundation analysis of CMS PDP enrollment, crosswalk, and landscape files, 2006-2014.
Exhibit 6 Change in Weighted Average Premiums for Medicare Part D Stand-Alone Prescription Drug Plans, by Region, 2014 National Average: 5% increase -4% ME, NH 7% OR, WA 2% CT, MA, RI, VT 9% -4% 6% IA, MN, MT, NE, ND, SD, WY 5% 11% NJ 9% ID, UT 6% PA, WV 5% 16% 2% 4% 1% IN, KY 5% 15% DE, DC, MD 4% 4% 4% 2% 2% AL, TN 10% 3% 12% 9% 2% 2% 5% -6% 9% 3% 0% 14% -6% to 0% change (4 regions) 1% to 3% change (9 regions) 4% to 6% change (9 regions) 7% to 16% change (12 regions) NOTE: Includes 168 plans under CMS sanction and closed to new enrollees as of October 2013. SOURCE: Georgetown/NORC/Kaiser Family Foundation analysis of CMS PDP enrollment, crosswalk, and landscape files, 2013-2014.
Exhibit 7 Share of Medicare Part D Stand-Alone Prescription Drug Plans, By Type of Gap Coverage, 2006-2014 In 2014, the coverage gap is partially filled by a 50% price discount and 2.5% plan payment for brand-name drugs and 28% plan payment for generic drugs, as required by the ACA 69% 71% 72% 73% 75% 76% 81% 85% 82% No/Little Additional Gap Coverage Mostly Generics 14% Generics and Brands 18% 17% 27% 29% 2% 25% 19% 13% 16% 13% 9% 7% 2% 2006 1,429 PDPs 1,875 PDPs 1,824 PDPs 1,689 PDPs 1,576 PDPs 1,109 PDPs 1,041 PDPs 1,031 PDPs 1,169 PDPs 1% 2007 2008 2009 2010 2011 2012 2013 2014 NOTE: ACA is the Patient Protection and Affordable Care Act. Analysis excludes plans in the territories. The category "No/little" gap coverage includes plans offering coverage of few generics (and for 2014 few brands). In 2008 and 2009, the number of plans offering gap coverage for brands rounds to 0%. Totals may not sum to 100% due to rounding. Total for 2014 includes 168 plans under CMS sanction and closed to new enrollees as of October 2013; 2014 analysis excludes missing coverage gap data for SmartD Rx Plus PDP (3% of PDPs in 2014). SOURCE: Georgetown/NORC/Kaiser Family Foundation analysis of CMS PDP landscape source files, 2006-2014.
Exhibit 8 Share of Medicare Part D Stand-Alone Prescription Drug Plans, By Type of Gap Coverage,* 2014 In 2014, the coverage gap is partially filled by a 50% price discount and 2.5% plan payment for brand-name drugs and 28% plan payment for generic drugs, as required by the ACA Additional gap coverage for generics and brands includes: Many generics and some brands (6%) Many generics and few brands (<1%) Some generics and some brands (7%) Generics and brands No/little additional gap coverage includes: No gap coverage (76%) Few generics (3%) Few brands (3%) 13% No/little additional gap coverage 82% Mostly generics 2% Additional gap coverage for mostly generics includes: Some generics (1%) Many generics (1%) Missing Total Number of PDPs in 2014 = 1,169 NOTE: ACA is the Patient Protection and Affordable Care Act. PDP is prescription drug plan. Total includes 168 plans under CMS sanction and closed to new enrollees as of October 2013. Missing coverage gap data is for SmartD Rx Plus PDP. *Percent of formulary drugs covered in the gap: few =>0%-<10%; some = 10%-<65%; many = 65%-<100%. SOURCE: Georgetown/NORC/Kaiser Family Foundation analysis of CMS PDP landscape source file, 2014.
Exhibit 9 Share of Medicare Part D Stand-Alone Prescription Drug Plans, By Deductible Amount, 2006-2014 No deductible 40% 42% 45% 47% 47% Partial deductible 55% 58% 59% 60% Standard deductible 4% 10% 18% 24% 10% 11% 8% 8% 8% 49% 45% 43% 40% 36% 34% 34% 33% 32% Standard deductible amount: 2006 2007 2008 2009 2010 2011 2012 2013 2014 $250 $265 $275 $295 $310 $310 $320 $325 $310 NOTE: Estimates may not sum to total due to rounding. Analysis for 2014 includes 168 plans under CMS sanction and closed to new enrollees as of October 2013. SOURCE: Georgetown/NORC/Kaiser Family Foundation analysis of CMS PDP landscape source files, 2006-2014.
Exhibit 10 Number of Medicare Part D Stand-Alone Prescription Drug Plans Available Without a Premium to Low-Income Subsidy Recipients, 2006-2014 640 De minimis plans* Benchmark plans 157 495 53 409 352 332 331 327 308 307 79 74 75 113 483 442 409 308 307 273 258 252 218 Total number of PDPs: 2006 1,429 PDPs 2007 1,875 PDPs 2008 1,824 PDPs 2009 1,689 PDPs 2010 1,576 PDPs 2011 1,109 PDPs 2012 1,041 PDPs 2013 1,031 PDPs 2014 1,169 PDPs NOTE: PDP is prescription drug plan. Excludes plans in the territories. Analysis for 2014 includes 168 plans under CMS sanction and closed to new enrollees as of October 2013. *De minimis plans can retain Low-Income Subsidy beneficiaries despite exceeding the benchmark premium by $2 in 2007, $1 in 2008, and $2 in 2011-2014. SOURCE: Georgetown/NORC/Kaiser Family Foundation analysis of CMS PDP landscape source files, 2006-2014.
Exhibit 11 Number of Benchmark Plans, by Region, 2014 Total Number of Benchmark Plans Across All Regions = 352 4 to 7 (6 regions) 8 to 10 (8 regions) 11 to 12 (10 regions) 13 to 15 (10 regions) 7 ME, NH 12 OR, WA 8 10 8 CT, MA, RI, VT 12 IA, MN, MT, NE, ND, SD, WY 13 12 NJ 13 13 ID, UT 13 PA, WV 12 14 4 15 IN, KY 13 5 8 13 DE, DC, MD 9 10 8 11 AL, TN 12 12 11 7 9 13 14 11 11 5 4 HI NOTE: Includes de minimis plans that can retain Low-Income Subsidy beneficiaries despite exceeding the benchmark premium by $2 in 2014; includes 168 plans under CMS sanction and closed to new enrollees as of October 2013. SOURCE: Georgetown/NORC/Kaiser Family Foundation analysis of CMS PDP landscape source file, 2014.
Exhibit 12 Change in Number of Benchmark Plans, By Region, 2013-2014 Net Change in Benchmark Plans Across All Regions = +21 Increase +1 to +4 (20 regions) No change (5 regions) Decrease -1 to -6 (9 regions) -3 ME, NH +2 OR, WA +2 CT, MA, RI, VT +2 -4 +2 +3 IA, MN, MT, NE, ND, SD, WY +2 NJ +3 ID, UT -1 PA, WV +4 +4 +2 0 +4 IN, KY +3 +1 DE, DC, MD 0 +3 +3 +2 -2 +1 -3 -6 +1 0 AL, TN -4 0 0 -1 +4 +3 -6 HI NOTE: Analysis includes 168 plans under CMS sanction and closed to new enrollees as of October 2013. SOURCE: Georgetown/NORC/Kaiser Family Foundation analysis of CMS PDP landscape source files, 2013-2014.
Exhibit 13 Low-Income Subsidy (LIS) Enrollment by Benchmark Plan Status, as of 2014 Open Enrollment Period 2013 plan IS benchmark plan in 2014 2013 plan IS NOT benchmark plan in 2014 6.3 million LIS enrollees (77%) 1.9 million LIS enrollees (23%) Total LIS Enrollment in PDPs in 2013 = 8.2 million NOTE: CMS is Centers for Medicare & Medicaid Services. PDP is prescription drug plan. Analysis includes enrollment in PDPs only. Analysis includes 168 plans under CMS sanction and closed to new enrollees as of October 2013. SOURCE: Georgetown/NORC/Kaiser Family Foundation analysis of CMS PDP enrollment, crosswalk, and landscape files, 2013-2014.
Exhibit 14 Number of Benchmark Plans Offered by Four Major Part D Organizations, 2006-2014 Number of PDP regions (out of 34): 2006 2007 2008 2009 2010 2011 2012 2013 2014 34 34 34 34 34 34 34 33 32 31 31 30 30 30 28 28 28 27 27 27 25 25 23 22 22 21 21 20 17 15 10 9 7 4 3 0 CVS Caremark 2,635,000 LIS enrollees in 2013 Humana UnitedHealth 1,057,000 LIS enrollees in 2013 Cigna 1,112,000 LIS enrollees in 2013 1,014,000 LIS enrollees in 2013 NOTE: PDP is prescription drug plan. Plan count for Cigna for 2014 includes recently-acquired HealthSpring plans. SOURCE: Georgetown/NORC/Kaiser Family Foundation analysis of CMS PDP landscape source files, 2006-2014.