Explore the comprehensive curriculum of the Meteorological Instrumentation and Observations course at Al-Mustansiriyah University College of Sciences At the Atmospheric Sciences Department. Covering data processing, temperature measurement, wind measurement, radiation, pressure measurement, moisture measurement, upper atmosphere measurement, weather radar, satellite observations, precipitation measurement, and weather maps. Understand the importance of atmospheric observations and the various methods used, including in-situ measurement and active versus passive remote sensing.
Please find below an Image/Link to download the presentation.
The content on the website is provided AS IS for your information and personal use only. It may not be sold, licensed, or shared on other websites without obtaining consent from the author. If you encounter any issues during the download, it is possible that the publisher has removed the file from their server.
You are allowed to download the files provided on this website for personal or commercial use, subject to the condition that they are used lawfully. All files are the property of their respective owners.
The content on the website is provided AS IS for your information and personal use only. It may not be sold, licensed, or shared on other websites without obtaining consent from the author.
E N D
Presentation Transcript
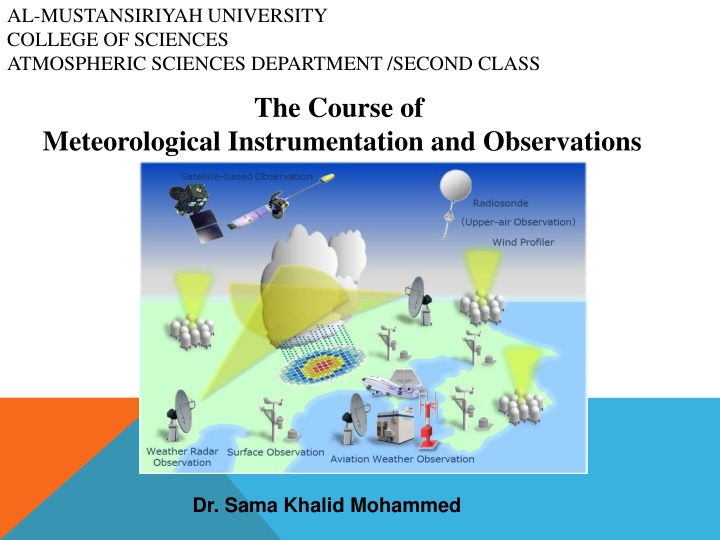
AL-MUSTANSIRIYAH UNIVERSITY COLLEGE OF SCIENCES ATMOSPHERIC SCIENCES DEPARTMENT /SECOND CLASS The Course of Meteorological Instrumentation and Observations Dr. Sama Khalid Mohammed
What are covered in this course? 1. Data Processing 2. Temperature measurement Basic principles Sensor types Response time 6. Wind measurement Mechanical method Electrical method 7. Radiation Basic principles Sensors 8. Clouds measurement 3. Pressure measurement Basic principles Sensors 4. Moisture measurement Moisture Variables Basic Principles Sensors 9. Upper atmosphere measurement 10. Weather radar 11. Satellite observations 5. Precipitation measurement Rain gauges Radars for precipitation 12. Weather Maps and how to represent Weather Phenomena
Chapter 1: Introduction Why do we make atmospheric observations? For current weather observation, now-casting, and forecasting For climatologically purposes, and to measure climate variability Vital for atmospheric research, and process studies The Basic parameters that describe the surface & upper air Properties include: pressure, temperature, humidity, winds, clouds, precipitation, etc .
We can make these observations in two ways: measurements obtained through direct contact with the respective object(basically you take measurements of the parameters right were you are) they measure the parameters from where they are located at that moment, Surface(stations, ships, or, buoys), or upper-air(rockets; balloons, and aircrafts) In situ measurement acquisition of information of an object or phenomenon, by the use of either recording or real-time sensing wireless, not in physical or intimate contact with the object. Active remote sensing Remote sensing measurement devices that are Passive remote sensing
Active remote Sensing: Makes use of sensors that detect reflected responses from objects that are irradiated from artificially-generated energy sources, such as radar(send out radiation, hoping to get it back to analyze it ). Passive Remote Sensing: Makes use of sensors that detect the reflected or emitted electro-magnetic radiation from natural sources (wait for radiation to come to them so that they can analyze the data)
Steps needed to make measurements for a specific application: 1. Define and research the problem (literature review is advised). What parameters are required and what must be measured. What is the frequency of the observations that will be required? How long will the observations be made? What level of error is acceptable? 2. Know and understand the instruments that will be used (consider cost, durability, and availability). 3. Apply instruments and data processing (consider deployment, and data collection). 4. Analyze the data (apply computational tools, statistics, etc..).
A measurement is a quantity that has both a number and a unit. 2.34 g 36.1 mL 16.5 Years Old Measurements are fundamental to the experimental sciences. For that reason, it is important to be able to MAKE measurements and to decide whether a measurement is CORRECT. -- Are you certain that your measurement is correct? HOW certain are you???
General Concepts Understanding measurement: The ability of the instrument to measure a quantity with little or no deviation among measurements (describes the degree to which measurements show the same or similar results) also called reproducibility or repeatability Accurcy How close the measurement made is to the actual value(is the difference between what we measured and the true (yet unknown) value). Precision Sensitivity Ability of instrument to detect change.
Error Error -is the difference between the actual value of a quantity and the value obtained in measurement. Acutal value standard or reference of known value or a theoretical value. There are 2 main types of error: SYSTEMATICS ERRORS ERROR IN MEASUREMENT Random Errors
Systematic errors are biases in measurement which lead to the situation where the mean of many separate measurements differs from the actual value of the measured attribute. Systematic errors: (a) constant, or (b) varying depending on the actual value of the measured quantity. When they are constant, they are simply due to incorrect zeroing of the instrument(when the measuring instrument does not start from exactly zero). When they are not constant, they can change sign. e.g. the systematic error is 2% of the actual value actual value: 100 , 0 , or 100 +2 0 2 A common method to remove systematic error is through calibration of the measurement instrument.
Random errors 1. Random errors arise from unknown and unpredictable variations in condition. 2. It fluctuates from one measurement to the next. 3. Random errors are caused by factors that are beyond the control of the observers. 4. Random error can cause by personal errors such as human limitations of sight and touch. lack of sensitivity of the instrument: the instrument fail to respond to the small change. natural errors such as changes in temperature or wind, while the experiment is in progress. wrong technique of measurement. 5. One example of random error is the parallax error. Random error can be reduced by - taking repeat readings - find the average value of the reading.
Parallax error A parallax error is an error in reading an instrument due to the eye of the observer and pointer are not in a line perpendicular to the plane of the scale. http://4.bp.blogspot.com/_PyvjcvYfRLk/SWHiqK1cW-I/AAAAAAAAAWk/-JD0bXAqWa0/s400/parallax+error-03.png
How to express errors: Absolute Error = |Measured Value- Actual Value | Relative Error = Absolute Error / Actual Value Percentage Errors = Relative Error x100% Fundamentals Data processing concepts A. Simple statistics B. Significant figures
Simple statistics 1 1 n Averaging = + + + = [( ) 1 ( ) 2 ( ... ( )] ( ) x x x x n x t = n n 1 t Variance 2 x= 2 ' x 2' x Standard deviation x= 1 n = ( ' ) ( ' ) x y x i y i covariance = n 1 i x ( y ) = Correlation coefficient xy x y
EXPRESSING ACCURACY AND PRECISION Mean (average) Percent error Range Deviation Standard deviation Percent coefficient of variation accuracy precision
Significant Figures (Sig Figs) = Known + ESTIMATE The significant figures in a measurement include all of the digits that are known, plus a last digit that is estimated. Significant Figures relate to the certainty of a measurement The PRECISION of the measurement
Precision = Same REPEATABLE Value (Certainty) More Sig Figs = more certainty = greater precision _ _ 1 sig fig (. 1 sig fig (.6 6 is the estimate) is the estimate) _ _ 2 sig figs (.0 2 sig figs (.01 1 is the estimate) is the estimate) Most Most certainty certainty and greatest PRECISION greatest PRECISION and _ _ 3 sig figs 3 sig figs Which measurement has the most Which measurement has the most certainty certainty and greatest PRECISION? and greatest PRECISION?
RULES FOR COUNTING SIGNIFICANT FIGURES - DETAILS Nonzero integers Nonzero integers always count as significant figures. significant figures. always count as 3456 3456 has 4 4 sig figs sig figs. . has
RULES FOR COUNTING SIGNIFICANT FIGURES - DETAILS Zeros Zeros - - Leading zeros Leading zeros do not count as significant figures. significant figures. do not count as 0.0486 0.0486 has 3 3 sig figs. sig figs. has
RULES FOR COUNTING SIGNIFICANT FIGURES - DETAILS Zeros Zeros - - count as significant figures. count as significant figures. Captive zeros Captive zeros always always 16.07 16.07 has 4 4 sig figs. sig figs. has
RULES FOR COUNTING SIGNIFICANT FIGURES - DETAILS Zeros Zeros Trailing zeros Trailing zeros are significant only if are significant only if the number contains a decimal the number contains a decimal point. point. 9.300 9.300 has 4 4 sig figs. sig figs. has
RULES FOR COUNTING SIGNIFICANT FIGURES - DETAILS Exact numbers Exact numbers have an infinite have an infinite number of significant figures. number of significant figures. 1 1 inch inch = = 2.54 2.54 cm, exactly cm, exactly
SIG FIG PRACTICE #1 How many significant figures in each of the following? 5 sig figs 1.0070 m 4 sig figs 17.10 kg 5 sig figs 100,890 L 3.29 x 10³ s 3 sig figs 2 sig figs 0.0054 cm 3,200,000 2 sig figs
RULE-2: Every digit in scientific notation is Significant = 3 S.F = 2 S.F 4.73 x 101 47.3 0.0021 2.1 x 10⁻³ 1.200 1.200 x 100 3.6 x 101 = 4 S.F 36 = 2 S.F = 2 S.F 2400 2.4 x 103 = 3 S.F 6.00 x 10⁻² 0.0600 = 3 S.F 1.04 x 10⁵ 104,000
RULES FOR SIGNIFICANT FIGURES IN MATHEMATICAL OPERATIONS Multiplication and Division Multiplication and Division: : # sig figs in the result equals the number in the least precise measurement used in the # sig figs in the result equals the number in the least precise measurement used in the calculation. calculation. 6.38 x 2.0 = 6.38 x 2.0 = 12.76 12.76 13 (2 sig figs) 13 (2 sig figs)
SIG FIG PRACTICE #2 Calculation Calculator says: 22.68 m2 Answer 23 m2 3.24 m x 7.0 m 100.0 g 23.7 cm3 4.219409283 g/cm34.22 g/cm3 0.02 cm x 2.371 cm 0.04742 cm2 710 m 3.0 s 0.05 cm2 236.6666667 m/s 240 m/s 5870 lb ft 2.96 g/mL 1818.2 lb x 3.23 ft 5872.786 lb ft 2.9561 g/mL 1.030 g 2.87 mL
RULES FOR SIGNIFICANT FIGURES IN MATHEMATICAL OPERATIONS Addition and Subtraction Addition and Subtraction: The number of decimal places in the result equals the : The number of decimal places in the result equals the number of decimal places in the least precise measurement. number of decimal places in the least precise measurement. 6.8 + 11.934 = 6.8 + 11.934 = 18.734 18.734 18.7 18.7 ( (3 sig figs 3 sig figs) )
SIG FIG PRACTICE #3 Calculation Calculator says: 10.24 m Answer 10.2 m 3.24 m + 7.0 m 100.0 g - 23.73 g 76.3 g 76.27 g 0.02 cm + 2.371 cm 2.39 cm 2.391 cm 713.1 L - 3.872 L 709.228 L 709.2 L 1821.6 lb 1818.2 lb + 3.37 lb 1821.57 lb 0.16 mL 0.160 mL 2.030 mL - 1.870 mL
Guesses only, dont write any of this down YET. Guesses only, don t write any of this down YET. There are rules (hints) to help you in There are rules (hints) to help you in determining the number of significant determining the number of significant figures there are in a measurement. figures there are in a measurement.
= __ S.F 3 = 5 S.F = Unlimited = 2 S.F = 5 S.F = 4 S.F Guesses only, don t write any of this down YET. Guesses only, don t write any of this down YET. There are rules (hints) to help you in There are rules (hints) to help you in determining the number of significant determining the number of significant figures there are in a measurement. figures there are in a measurement.
3.1 SECTION QUIZ 1. Which set of measurements of a 2.00-g standard is the most precise? 2.00 g, 2.01 g, 1.98 g 2.10 g, 2.00 g, 2.20 g 2.02 g, 2.03 g, 2.04 g 1.50 g, 2.00 g, 2.50 g
3.1 SECTION QUIZ 2. A student reports the volume of a liquid as 0.0130 L. How many significant figures are in this measurement? 2 3 4 5


 = Known + ESTIMATE")
")