Electrical generation, transmission, and distribution systems integrating advanced technology for real-time communication and automated responses. Implementing Smart Grid technology for efficient monitoring and control of smart meters. Benefits of AMI and smart grid technology, enabling utilities to deploy cost-effective solutions and enhance monitoring capabilities.
Please find below an Image/Link to download the presentation.
The content on the website is provided AS IS for your information and personal use only. It may not be sold, licensed, or shared on other websites without obtaining consent from the author. If you encounter any issues during the download, it is possible that the publisher has removed the file from their server.
You are allowed to download the files provided on this website for personal or commercial use, subject to the condition that they are used lawfully. All files are the property of their respective owners.
The content on the website is provided AS IS for your information and personal use only. It may not be sold, licensed, or shared on other websites without obtaining consent from the author.
E N D
Presentation Transcript
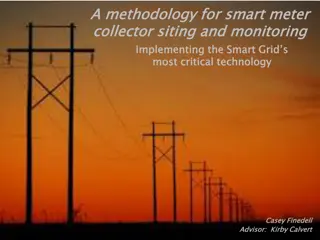
A methodology for collector A methodology for smart meter collector siting and monitoring smart meter siting and monitoring Implementing the most Implementing the Smart most critical technology Smart Grid s Grid s critical technology Casey Casey Finedell Finedell Advisor: Kirby Calvert Advisor: Kirby Calvert
Electrical generation, transmission, and distribution systems Capable of real-time communication and automated responses to load demands and outage events through advanced technology Programmed responses to system adversity
Meters: Revenue information at various points of delivery Maintain fair and equitable electricity for all Record total usage and forecast peak demand Automated Meter Infrastructure (AMI): Two-way communication between a central server and end consumer Save time in standard operations Bring field capabilities to the office
Contribute to the planning, siting, and interactivity of AMI Enable utilities to deploy AMI in (cost) effective ways Gain full advantage of the benefits of increased monitoring and control
System Control and Data Acquisition Network of devices and sensors Transmit detailed information to a central interface Providing the same information and control as if the operator is in the field
Simple gauges and switches wired from control rooms onsite at substations Complex communication Real-time data Detailed reporting Automated response
Two-way communication Meter to server communication Control for remote disconnect Collect read information only Trouble reporting for outage management No monitoring Provide interface for consumer interaction No control
Smart grid provides the framework for: Ability to coordinate multiple generation locations and schedules Fluctuations in renewable energy production Evening hours Low wind Can be automatically offset and equalized by increasing generation from traditional sources Local energy to be returned to the grid: Distributed generation facilities (non-transmission level) Home renewable energy production
Self reporting outages Pinging capabilities for outage assessment Verification of outage restoration
This AMI system uses two communication formats: Mesh radio network to communicate locally Cellular technology to interface with central server http://www.fujitsu.com/global/services/solutions/sensor http://www.fujitsu.com/global/services/solutions/sensor- -network/ami network/ami- -solution/ solution/
Self-configuring nodes Multiple routing paths Use of spread spectrum radios Broadcast on ISM (instrumentation, scientific and medical) band frequencies - Capehart and Capehart (2007, 322-323)
Python is the preferred object-oriented programming language for ArcGIS applications Runs smoothly with existing mapping system No additional programs to install to interface with GIS data Once code is written, it is simple to modify Python is free and open source Automates saving time and increasing accuracy Only cost is knowledge of the language structure Zandbergen (2013)
Identify and calculate meter density Proximity selection using a Python script Write values of quantity of neighboring meter points meeting parameters in this case within 1200 feet Repeat as many times as desired using selected sets for each successive selection in this case 8 hops Symbolize in ArcMap based on quantity using quantile classification Symbolize for each data hop
Map symbol used will have a ringed theme Class symbology for quantity at each threshold Helps visualize density at each hop
Expected and unexpected areas of communication densities Using identify function to view hop specific data
Complete methodology for AMI collector siting and visualization Functional and transferable Python script to calculate meter proximity Map document - minimal local customization Network map for creating nightly SQL update Simple web based map viewer for final results
Planning, installation, and monitoring Daily tool for metering managers visualization of AMI communication Scalable and applicable to multiple sizes and industries Moderate expertise needed to follow methodology and embrace benefits
References A Brief History of Electric Utility Automation Systems, article by H. Lee Smith. (2010). Retrieved from http://www.electricenergyonline.com/show_article.php?mag=63&article=491 Baird, G. (2011). Expressway to the Future: GIS and Advanced Metering Infrastructure. Journal: American Water Works Association. Volume 103, Issue 1, January 2011, pages 34-39 Capehart, Barney & L. Capehart, Lynne C. (2007). Web Based Enterprise Energy and Building Automation Systems. (pp. 318-328). Fairmont Press, Inc.. Retrieved from: http://app.knovel.com/hotlink/toc/id:kpWBEEBAS1/web-based-enterprise Carr, N. (2008). The Big Switch: Rewiring the World from Edison to Google. New York, NY: W. W. Norton & Company Ltd. Cousins, A. (2009) Integrating Automated Metering Infrastructure (AMI) with GIS to Predict Electrical Outages. Spokane, WA: Avista Corporation. Retrieved from: http://proceedings.esri.com/library/userconf/egug2009/papers/tuesday/integr~1.pdf Electric Power Research Institute. (2011) Estimating the Costs and Benefits of the Smart Grid. Retrieved from: http://ipu.msu.edu/programs/MIGrid2011/presentations/pdfs Finedell, C. Automated Metering Infrastructure (AMI) Deployment Module. (2013). Retrieved from caseyfinedell.weebly.com Meehan, B. (2007). Empowering Electric and Gas Utilities with GIS. Redlands, CA: ESRI Press Patel, S., Scafuto, R., Westrup, W. & Troxell, D. (2009) Deploying AMI Solutions: A Best Practices Approach. AT&T Wireless. Retrieved from: http://smartgridcc.org/wp-content/uploads/2014/01/AMI-White-Paper-ATT.pdf Rodrigue, C. (2007). Map Symbolism [Lecture notes]. Retrieved from: http://www.csulb.edu/~rodrigue/geog140/lectures/symbolism.html Sioshansi, Fereidoon P. (2013). Energy Efficiency - Towards the End of Demand Growth. (pp. 430-432). Elsevier. Online version available at: http://app.knovel.com/hotlink/toc/id:kpEETEDG06/energy-efficiency-towards Zandbergen, P. (2013). Python Scripting for ArcGIS. Redlands, CA: ESRI Press