Methods for Supervised Classification in Satellite Image Analysis
A variety of methods exist for supervised classification in satellite image analysis, including Parallelepiped Classification and Minimum Distance Classification. These methods utilize training data to assign pixels to specific categories based on spectral values. While these methods offer accuracy and simplicity, they also have limitations such as potential overlap of spectral regions and unclassified areas in the image. Despite these challenges, these techniques remain commonly used in image classification, particularly in the analysis of Landsat data.

Uploaded on Feb 25, 2025 | 1 Views
Download Presentation

Please find below an Image/Link to download the presentation.
The content on the website is provided AS IS for your information and personal use only. It may not be sold, licensed, or shared on other websites without obtaining consent from the author.If you encounter any issues during the download, it is possible that the publisher has removed the file from their server.
You are allowed to download the files provided on this website for personal or commercial use, subject to the condition that they are used lawfully. All files are the property of their respective owners.
The content on the website is provided AS IS for your information and personal use only. It may not be sold, licensed, or shared on other websites without obtaining consent from the author.
E N D
Presentation Transcript
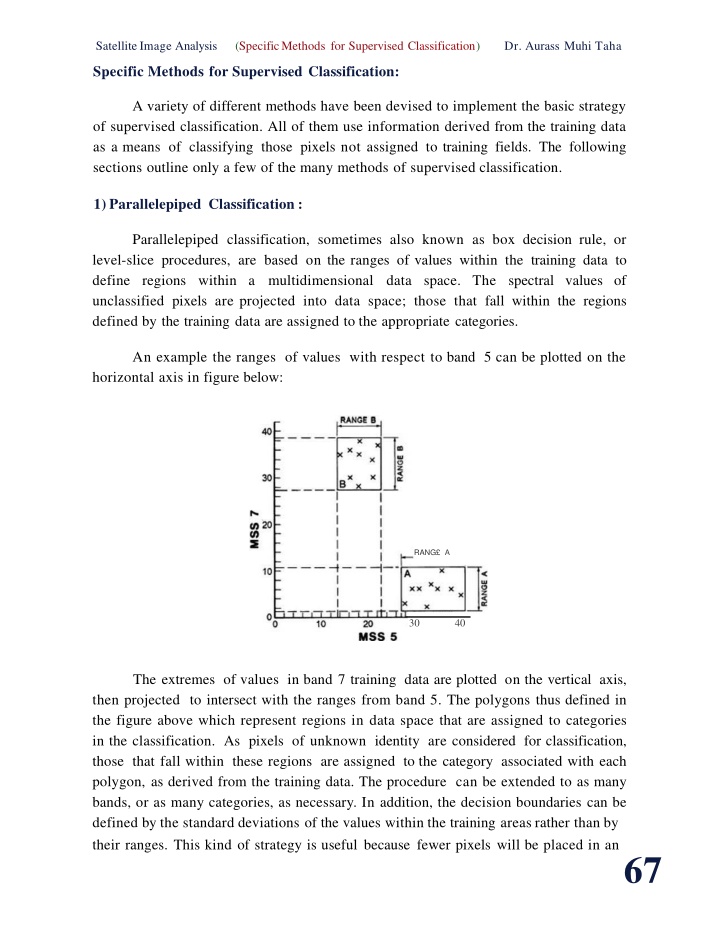
SatelliteImage Analysis (SpecificMethods for Supervised Classification) Dr. Aurass Muhi Taha Specific Methods for Supervised Classification: A variety of different methods have been devised to implement the basic strategy of supervised classification. All of them use information derived from the training data as a means of classifying those pixels not assigned to training fields. The following sections outline only a few of the many methods of supervised classification. 1)Parallelepiped Classification : Parallelepiped classification, sometimes also known as box decision rule, or level-slice procedures, are based on the ranges of values within the training data to define regions within a multidimensional data space. The spectral values of unclassified pixels are projected into data space; those that fall within the regions defined by the training data are assigned to the appropriate categories. An example the ranges of values with respect to band 5 can be plotted on the horizontal axis in figure below: RANG A 30 40 The extremes of values in band 7 training data are plotted on the vertical axis, then projected to intersect with the ranges from band 5. The polygons thus defined in the figure above which represent regions in data space that are assigned to categories in the classification. As pixels of unknown identity are considered for classification, those that fall within these regions are assigned to the category associated with each polygon, as derived from the training data. The procedure can be extended to as many bands, or as many categories, as necessary. In addition, the decision boundaries can be defined by the standard deviations of the values within the training areas rather than by their ranges. This kind of strategy is useful because fewer pixels will be placed in an67
SatelliteImage Analysis (SpecificMethods for Supervised Classification) Dr. Aurass Muhi Taha "unclassified" category (a special problem for parallelepiped classification), but it also increases the opportunity for classes to overlap in spectral data space. Although this procedure for classification has the advantages of accuracy, directness, and simplicity, some of its disadvantages are obvious. Spectral regions for informational categories may intersect. Training data may underestimate actual ranges of classification and leave large areas in data space and on the image unassigned to informational categories. Also, the regions as defined in data space are not uniformly occupied by pixels in each category; those pixels near the edges of class boundaries may belong to other classes. Also, if training data do not encompass the complete range of values encountered in the image (as is frequently the case), large areas of the image remain unclassified, or the basic procedure described here must be modified to assign these pixels to logical classes. This strategy was among the first used in the classification of Landsat data and is still used, although it may not always be the most effective choice for image classification. 2) l\!Iinimum Distance Classification: Another approach to classification uses the central values of the spectral data that form the training data as a means of assigning pixels to informational categories. The spectral data from training fields can be plotted in multidimensional data space in the same manner illustrated previously for unsupervised classification. Values in several bands determine the positions of each pixel within the clusters that are formed by training data for each category: :: , .z .. ._ A .J B .... ........ ... . . D These clusters may appear to be the same as those defined earlier for unsupervised classification. However, in unsupervised classification, these clusters of pixels were defined according to the "natural" structure of the data. Now, for68
Satellite Image Analysis (Specific Methods for Supervised Classification) Dr. Aurass Muhi Taha supervised classification, these groups are formed by values of pixels within the training fields defined by the analyst. Each cluster can be represented by its centroid, often defined as its mean value. As unassigned pixels are considered for assignment to one of the several classes, the multidimensional distance to each cluster centroid is calculated, and the pixel is then assigned to the closest cluster. Thus the classification proceeds by always using the "minimum distance" from a given pixel to a cluster centroid defined by the training data as the spectral manifestation of an informational class. Minimum distance classifiers are direct in concept and in implementation but are not widely used in remote sensing work. In its simplest form, minimum distance classification is not always accurate; there is no provision for accommodating differences in variability of classes, and some classes may overlap at their edges. It is possible to devise more sophisticated versions of the basic approach just outlined by using different distance measures and different methods of defining cluster centroids. 3) ISODATA: The ISODATA classifier is a variation on the mmtmum distance method; however, it produces results that are often considered to be superior to those derived from the basic minimum distance approach. ISODATA is often seen as a form of supervised classification, although it differs appreciably from the classical model of supervised classification presented at the beginning ofthis chapter. It is a good example of a technique that shares characteristics of both supervised and unsupervised methods (i.e., "hybrid" classification) and provides evidence that the distinction between the two approaches is not as clear as idealized descriptions imply. ISODATA starts with the training data selected , as previously described; these data can be envisioned as clusters in multidimensional data space. All unassigned pixels are then assigned to the nearest centroid. Thus far the approach is the same as described previously for the minimum distance classifier. Next , new centroids are found for each group, and the process of allocating pixels to the closest centroids is repeated if the centroid changes position. The process is repeated until there is no change, or only a small change, in class centroids from one iteration to the next. A step by-step description is as follows: 1.Choose initial estimates of class means. These can be derived from training data; in this respect,ISODATA resembles supervised classification. 6
Satellite Image Analysis Taha (Specific Methods for Supervised Classification) Dr. Aurass Muhi 2.All other pixels in the scene are assigned to the class with the closest mean, as considered in multidimensional data space. 3.Class means are then recomputed to include effects of those pixels that may have been reassigned in Step 2. 4.If any class mean changes in value from Step 2 to Step 3, then the process returns to Step 2 and repeats the assignment of pixels to the closest centroid. Otherwise, the result at the end of Step 3 represents the final results. Steps 2, 3, and 4 use the methodology of unsupervised classification, although the requirement for training data identifies the method essentially as supervised classification. It could probably best be considered as a hybrid rather than as a clear example of either approach. 4) Maximum Likelihood Classification: In nature the classes that we classify exhibit natural variation in their spectral patterns. Further variability is added by the effects of haze, topographic shadowing, system noise, and the effects of mixed pixels. As a result, remote sensing images seldom record spectrally pure classes; more typically, they display a range of brightnesses in each band. The classification strategies considered thus far do not consider variation that may be present within spectral categories and do not address problems that arise when frequency distributions of spectral values from separate categories overlap. For example, for application of a parallelepiped classifier, the overlap of classes is a serious problem because spectral data space cannot then be neatly divided into discrete units for classification. This kind of situation arises frequently because often our attention is focused on classifying those pixels that tend to be spectrally similar rather than those that are distinct enough to be easily and accurately classified by other classifiers. As a result, the situation depicted in figure below is common. Assume that we examine a digital image representing a region composed ofthree-fourths forested land and one-fourth cropland. The two classes "Forest" and "Cropland" are distinct with respect to average brightness, but extreme values (very bright forest pixels or very dark crop pixels) are similar in the region where the two frequency distributions overlap. (For clarity, the figure shows data for only a single spectral band, although the principle extends to values observed in several bands and to more than the two classes shown here.) Brightness value "45" falls into the region of overlap, where we cannot make a clear assignment to either "Forest" or "Cropland." Using the kinds of decision rules 7
SatelliteImage Analysis (SpecificMethods for Supervised Classification) Dr. Aurass Muhi Taha mentioned above, we cannot decide which group should receive these pixels unless we place the decision boundary arbitrarily. Class A Class B DARK 45 BRIGHT IMAGE BRIGHTNESS - Maximum likelihood classification. pixels from two training fields; the zone of overlap depicts pixel values common to both categories. The relation of the pixels within the region of overlap to the overall frequency distribution for each class defines the basis for assigning pixels to classes. Here, the relationship between the two histograms indicates that the pixel with the value "45" is more likely to belong to the Forest ("F") class rather than the Crop ("C") class. These frequency distributions represent this situation, an effective classification would consider the relative likelihoods of "45 as a member of Forest" and "45 as a member of Cropland." We could then choose the class that would maximize the probability of a correct classification, given the information in the training data. This kind of strategy is known as maximum likelihood classification-it uses the training data as a means of estimating means and variances of the classes, which are then used to estimate the probabilities. lviaximum likelihood classification considers not only the mean, or average, values in assigning classification but also the variability of brightness values in each class. In The maximum likelihood decision rule, implemented quantitatively to consider several classes and several spectral channels simultaneously, forms a powerful classification technique. Itrequires intensive calculations, so it has the disadvantage of requiring more computer resources than do most of the simpler techniques mentioned above. Also, it is sensitive to variations in the quality of training data-even more so than most other supervised techniques. Computation of the estimated probabilities is based on the assumption that both training data and the classes themselves display multivariate normal (Gaussian) frequency distributions. training data should exhibit unimodal distributions, as discussed above.) Data from remotely sensed images often donot strictly adhere to this rule, although the departures (This is one reason that 71
Satellite Image Analysis (Specific Methods for Supervised Classification) Dr. Aurass Muhi Taha are often small enough that the usefulness of the procedure is preserved. Nonetheless, training data that are not carefully selected may introduce error. 5) Bayes's Classification: The classification problem can be expressed more formally by stating that we wish to estimate the "probability ofForest, given that we have an observed digital value 45," and the "probability of Cropland, given that we have an observed digital value 45." These questions are a form of conditional probabilities, written as "P(FI45)," and "P(CI45)," and read as "The probability of encountering category Forest, given that digital value 45has been observed at a pixel," and "The probability of encountering category Cropland, given that digital value 45 has been observed at a pixel." That is, they state the probability of one occurrence (finding a given category at a pixel), given that another event has already occurred (the observation of digital value 45 at that same pixel). Whereas estimation of the probabilities of encountering the two categories at random (without a conditional constraint) is straightforward (here P[F] = P[C] = 0.50, as mentioned above), conditional probabilities are based on two separate events. From our knowledge ofthe two categories as estimated from our training data, we can estimate P(45IF) (''the probability of encountering digital value 45, given that we have category Forest") and P(45IC) (''the probability of encountering digital value 45, given that we have category Cropland"). For this example, P(45IF) = 0.75, and P(45IC) = 0.25. However, what we want to know are values for probabilities of"Forest, given that we observe digital value 45" [P(FI45)] and "Cropland, given that we observe digital value 45" [P(CI45)], so that we can compare them to choose the most likely class for the pixel. These probabilities cannot be found directly from the training data. From a purely intuitive examination of the problem, there would seem to be no way to estimate these probabilities. 0.50, and But, in fact, there is a way to estimate P(FI45) and P(CI45) from the information at hand. Thomas Bayes (1702-1761) defined the relationship between the unknowns P(FI45) and P(CI45) and the known P(F), P(C), P(45 I F), and P(45IC). His relationship, now known asBayes's theorem, is expressed as follows for our example: P(F)P(4SIF) P(FI4S) = P(F)P(4SIF) + P(C)P(4SIC) P(C)P(4SIC) P(CI4S) = P( C)P(4SIC) + P(F)P( 451F) 72
Satellite Image Analysis (Specific Methods for Supervised Classification) Dr. Aurass Muhi Taha In a more general form, Bayes's theorem can be written: Where a1and a2 represent alternative results ofthe first stage of the experiment, and b1 and b2represent alternative results for the second stage. For our example, Bayes's theorem can be applied as follows: P(F)P(4SIF) P(FI4S) = P(F)P(4SIF) + P(C)P(4SIC) 3 / s 3 4;8 P(F)P( 4SIF) P(F)P(4SIF) + P(C)P(4SIC) 4 P(C)P(4SIC) P(CI4S) = P( C)P(4SIC) + P(F)P( 451F) 1 / s 1 4 f s 4 P(C)P(4SIC) P(C)P( 4SIC) + P(F)P( 4SIF) So we conclude that this pixel is more likely to be "Forest" than "Cropland." Usually data for several spectral channels are considered, and usually we wish to choose from more than two categories, so this example is greatly simplified. We can extend this procedure to as many bands or as many categories as may be necessary, although the expressions become more complex than can be discussed here. For remote sensing classification, application of Bayes's theorem is especially effective when classes are indistinct or overlap in spectral data space. It can also form a convenient vehicle for incorporating ancillary data (Section 12.5) into the classification , as the added information can be expressed as a conditional probability. In addition, it can provide a means of introducing costs of misclassification into the analysis. (Perhaps an error in misassignment of a pixel to Forest is more serious than a misassignment to Cropland.).Furthermore, we can combine Bayes's theorem with other classification procedures, so, for example, most of the pixels can be assigned using a parallelepiped classifier, and then a Bayesian classifier can be used for those pixels that are not within the decision boundaries or within a region of overlap. Some studies have shown that such classifiers are very accurate. 73
Satellite Image Analysis (Specific Methods for Supervised Classification) Dr. Aurass Muhi Taha Thus Bayes 's theorem is an extremely powerful means of using information at hand to estimate probabilities of outcomes related to the occurrence of preceding events. The weak point of the Bayesian approach to classification is the selection of the training data. If the probabilities are accurate, Bayes 's strategy must give an effective assignment of observations to classes. Of course , from a purely computational point of view, the procedure will give an answer with any values. But to ensure accurate classification, the training data must have a sound relationship to the categories they represent. For the multidimensional case, with several spectral bands, it is necessary to estimate for each category a mean brightness for each band and a variance---covariance matrix to summarize the variability of each band and its relationships with other bands. From these data we extrapolate to estimate means , variances, and covariances of entire classes. Usually this extrapolation is made on the basis that the data are characterized by multivariate normal frequency distributions. If such assumptions are not justified, the classification results may not be accurate. If classes and subclasses have been judiciously selected and if the training data are accurate, Bayes's approach to classification should be as effective as any that can be applied. If the classes are poorly defined and the training data are not representative of the classes to be mapped, then the results can be no better than those for other classifiers applied under similar circumstances. Use of Bayes's approach to classification forms a powerful strategy, as it includes information concerning the relative diversities of classes , as well as the means and ranges used in the previous classification strategies. The simple example used here is based on only a single channel of data and on a choice between only two classes. The same approach can be extended to consider several bands of data and several setsof categories. This approach to classification is extremely useful and flexible and , under certain conditions, provides what is probably the most effective means of classification given the constraints of supervised classification. Note, however, that in most applications , this strategy is limited by the quality of the estimates of the probabilities required for the classification; if these are accurate, the results can provide optimal classification ; if they are makeshift values conjured up simply to provide numbers for computation, the results may have serious defects. 74