Methods Used in 2014 Population Estimates in Texas
Producing population estimates is vital for planning and resource allocation. The methods employed in generating the 2014 population estimates in Texas involved data collection from various sources such as surveys, administrative records, and public data. The top-down methodology ensured accuracy by controlling county estimates to state estimates and place estimates to county estimates. The process included three main methods for county and place totals, namely Cohort Component II, Housing Unit Ratio, and Correlation. These methods utilized demographic details, age-sex-race distribution, and net migration calculations to determine population estimates with precision.

Download Presentation

Please find below an Image/Link to download the presentation.
The content on the website is provided AS IS for your information and personal use only. It may not be sold, licensed, or shared on other websites without obtaining consent from the author.If you encounter any issues during the download, it is possible that the publisher has removed the file from their server.
You are allowed to download the files provided on this website for personal or commercial use, subject to the condition that they are used lawfully. All files are the property of their respective owners.
The content on the website is provided AS IS for your information and personal use only. It may not be sold, licensed, or shared on other websites without obtaining consent from the author.
E N D
Presentation Transcript
Data and Methods Used in Producing the 2014 Population Estimates in Texas Texas Demography Conference May 18, 2016 Austin, Texas @TexasDemography
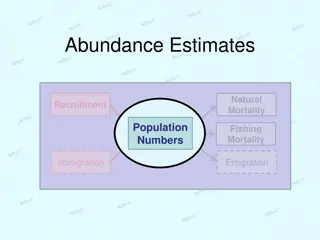
We produce annual estimates of the total populations of counties the total populations of places county populations by age, sex and race/ethnicity
You can access the data from our website (http://demographics.texas.gov) Download CSV/PDF files or use Population Estimate Tool
We collect SURVEY data private schools, annexation and boundary changes, and building permits ADMINISTRATIVE data vital statistics, voter registration, vehicle registration, nursing homes, medicare, prison and correctional facilities Public data decennial census, ACS
The methodology we used Top down -- County population estimates are controlled to the state estimates and place estimates are controlled to the county estimates Three methods for the county and place totals Cohort component II Housing Unit Ratio Correlation Projected age-sex-race distribution applied to county total to obtain estimates with demographic details.
Estimated Percent Change of the Total Population by County, Texas, 2010 to 2014
Methodology for County and Place Total Estimates Cohort Component II P(t+k) = Pt + B D + NetM Use school enrollment data and Medicare data to calculate net migration Housing Unit Use number of new building permits, type of units, demolition, occupancy rate to estimate population Ratio Correlation Use variables of births, deaths, school enrollment, vehicle registration and voter registration Regression models are used to estimate population
The 2014 Place Total Population Estimates (Top 10) Estimated Population July, 2014 2010-2014 Numeric Change Estimated Population July, 2014 2010-2014 Percent Change Place Place Houston 2,247,167 146,904 Fulshear 3,393 199.2 Austin 892,943 102,452 Escobares 2,418 103.5 San Antonio 1,428,340 100,933 DISH 353 75.6 Dallas 1,277,995 80,179 Buda 12,022 64.8 Fort Worth 809,062 67,856 Bee Cave 6,094 55.3 Frisco 144,936 27,947 Manvel 7,438 43.6 El Paso 675,308 26,187 Prosper 13,484 43.1 McLendon- Chisholm McKinney 152,838 21,721 1,954 42.3 Laredo 255,428 19,337 Selma 7,834 41.4 Plano 277,671 17,830 Manor 6,996 38.9
The 2014 Population Estimates by Age, Sex and Race/Ethnicity Project the age and sex distributions for NH White, NH Black, Hispanics and Other using cohort survival model and apply to the total county population estimates BASE POPULATION: 2010 Census population NEW COHORTages 0 to 3: vital statistics data with adjusted race distribution 2009-2011 rates of MORTALITY 2000-2010 NET MIGRATIOM for each cohort
The 2014 Population Estimates by Age, Sex and Race/Ethnicity Compare birth data with 0-year-olds in Census 2010 Vital Statistics (Mother's race) 0-Year-olds, 2010 Census Year NH White NH Black Hispanic Other Total Year NH White NH Black Hispanic Other Total 118,888 41,869 194,215 24,874 379,846 2010 132,002 43,327 189,504 20,969 385,802 2010 2011 2011 2012 2012 2013 2013 2014 2014 Year NH White NH Black Hispanic Other Year NH White NH Black Hispanic Other 31.3% 11.0% 51.1% 6.5% 2010 34.2% 11.2% 49.1% 5.4% 2010 2011 2011 2012 2012 2013 2013 2014 2014
The 2014 Population Estimates by Age, Sex and Race/Ethnicity Issues with using unadjusted births Vital Statistics (Mother's race) Unadjusted Births Year NH White NH Black Hispanic Other Total Year NH White NH Black Hispanic Other Total 118,888 41,869 194,215 24,874 379,846 2010 132,002 43,327 189,504 20,969 385,802 2010 2011 130,751 41,869 183,058 21,650 377,328 2011 130,751 41,869 183,058 21,650 377,328 2012 132,130 43,073 183,463 23,820 382,486 2012 132,130 43,073 183,463 23,820 382,486 2013 132,904 44,105 185,829 24,340 387,178 2013 132,904 44,105 185,829 24,340 387,178 2014 137,033 45,964 189,762 26,872 399,631 2014 137,033 45,964 189,762 26,872 399,631 Year NH White NH Black Hispanic Other Year NH White NH Black Hispanic Other 31.3% 11.0% 51.1% 6.5% 2010 34.2% 11.2% 49.1% 5.4% 2010 2011 34.7% 11.1% 48.5% 5.7% 2011 34.7% 11.1% 48.5% 5.7% 2012 34.5% 11.3% 48.0% 6.2% 2012 34.5% 11.3% 48.0% 6.2% 2013 34.3% 11.4% 48.0% 6.3% 2013 34.3% 11.4% 48.0% 6.3% 2014 34.3% 11.5% 47.5% 6.7% 2014 34.3% 11.5% 47.5% 6.7%
The 2014 Population Estimates by Age, Sex and Race/Ethnicity Adjusting race/ethnicity distributions Vital Statistics (Mother's race) Adjusted Births Year NH White NH Black Hispanic Other Total Year NH White NH Black Hispanic Other Total 118,888 41,869 194,215 24,874 379,846 2010 132,002 43,327 189,504 20,969 385,802 2010 118,257 41,691 194,959 26,991 381,898 2011 130,751 41,869 183,058 21,650 377,328 2011 118,407 41,905 193,758 28,289 382,359 2012 132,130 43,073 183,463 23,820 382,486 2012 120,198 43,165 196,143 30,244 389,750 2013 132,904 44,105 185,829 24,340 387,178 2013 121,495 44,523 198,907 31,862 396,787 2014 137,033 45,964 189,762 26,872 399,631 2014 Year NH White NH Black Hispanic Other Year NH White NH Black Hispanic Other 31.3% 11.0% 51.1% 6.5% 2010 34.2% 11.2% 49.1% 5.4% 2010 31.0% 10.9% 51.1% 7.1% 2011 34.7% 11.1% 48.5% 5.7% 2011 31.0% 11.0% 50.7% 7.4% 2012 34.5% 11.3% 48.0% 6.2% 2012 30.8% 11.1% 50.3% 7.8% 2013 34.3% 11.4% 48.0% 6.3% 2013 30.6% 11.2% 50.1% 8.0% 2014 34.3% 11.5% 47.5% 6.7% 2014
The 2014 Population Estimates by Age, Sex and Race/Ethnicity NH White NH Black Hispanic Other
Using the 2014 population estimates Due to the major revisions to the methodology, the 2014 estimated population by age/sex/race is not comparable to our previous years estimates, especially for those under age 4 Cautions should be taken in interpreting the estimates for small areas or small demographic groups; a larger geographic area and/or collapsing of age/sex/race groups are recommended
Looking into the future Making our estimates more timely Separation of the Asians from the Other race group Making year-to-year estimates more comparable
Questions and Feedbacks Dr. Helen You or Dr. Lloyd Potter Texas Demographic Center The University of Texas at San Antonio 501 W. C sar E. Ch vez Blvd. San Antonio, Texas 78207-4415 Ph: 210-458-6530 Fx: 210-458-6540 tdc@utsa.edu http://demographics.texas.gov