Metro Mobility Program Performance Metrics 2025
Explore key service performance metrics and KPI data for the Metro Mobility Program in 2025, including On-Time Performance, Appointment Time Performance, and On-Board Time Performance. Gain insights into ADA and non-ADA trip statistics, total trips, on-time and late trips, early arrivals, capacity denials, and more. Stay informed about the program's objectives and achievements in ensuring transportation accessibility for all riders.

Download Presentation

Please find below an Image/Link to download the presentation.
The content on the website is provided AS IS for your information and personal use only. It may not be sold, licensed, or shared on other websites without obtaining consent from the author. If you encounter any issues during the download, it is possible that the publisher has removed the file from their server.
You are allowed to download the files provided on this website for personal or commercial use, subject to the condition that they are used lawfully. All files are the property of their respective owners.
The content on the website is provided AS IS for your information and personal use only. It may not be sold, licensed, or shared on other websites without obtaining consent from the author.
E N D
Presentation Transcript
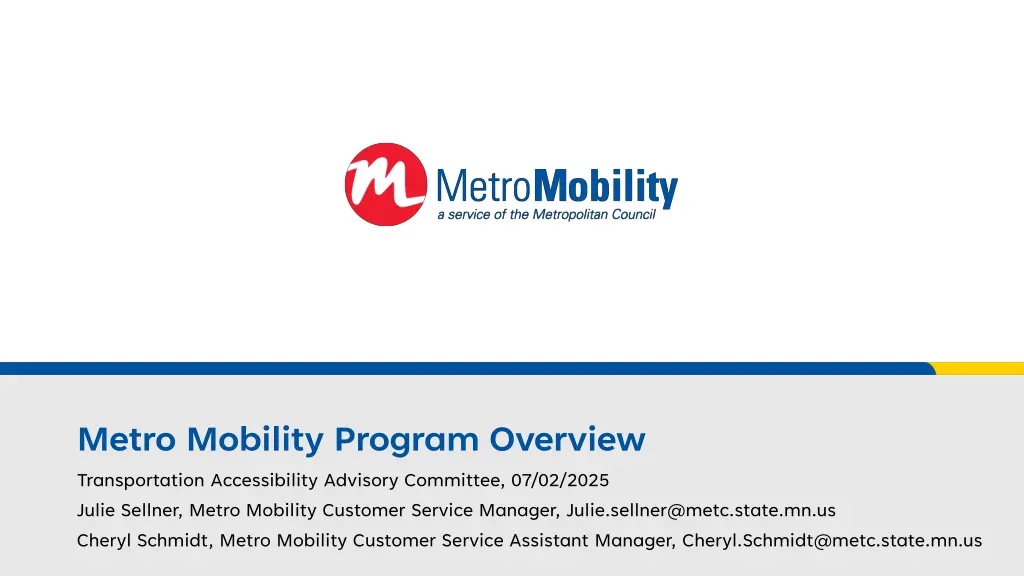
Metro Mobility Program Overview Transportation Accessibility Advisory Committee, 07/02/2025 Julie Sellner, Metro Mobility Customer Service Manager, Julie.sellner@metc.state.mn.us Cheryl Schmidt, Metro Mobility Customer Service Assistant Manager, Cheryl.Schmidt@metc.state.mn.us
Key Service Performance Metrics On-Time Performance (OTP): Percentage of all trips that arrive within 30-minutes of the negotiated pick-up time. KPI ADA Goal Non- ADA Goal Appointment Time (APPT): Percentage of all trips that arrived no later than the negotiated appointment time and no earlier than 30 minutes early* to the scheduled appointment time. (*effective 1/1/2024) OTP 100% (contract min. 90%) 85% APPT 100% (contract min. 85%) 85% On-Board Time (OBT): Percentage of trips that did not exceed the calculated maximum on board time. OBT 100% (contract min. 95%) 95% Denials Zero Zero Capacity Denials: Count of requested trips that were unable to be performed due to system capacity constraints. NOTE: The Americans with Disabilities Act (ADA) does not permit transit agencies to have any capacity constraints in ADA paratransit. Capacity constraints are defined as any operational patterns or practices that significantly limit the availability of service to ADA paratransit eligible individuals. 2
2025 Year To Date KPI Data On Time Performance ADA Trips Non-ADA Trips Total Trips On Time Performance: 93.6% 93.4% 93.5% Total Trips 482,302 187,513 669,815 On Time Trips 451,435 175,137 626,277 Late Trips 30,867 12,376 43,538 3
On Time Performance (ADA and non-ADA) On Time Performance 95 94.5 94 93.5 93 92.5 January February March April May June Month YTD 4
2025 Year To Date KPI Data Appointment Time Performance ADA Trips Non-ADA Trips Total Trips Appointment On Time Performance: 91.9% 90.4% 91.9% Total Trips 163,142 77,414 240,556 Early Trips 3,982 1,890 5,872 Late Trips 9,301 4,413 13,714 5
Appointment Time (both ADA and non-ADA) Appointment Time 95.5 95 94.5 94 93.5 93 92.5 92 91.5 91 90.5 90 January February March April May June Month YTD 6
2025 Year To Date KPI Data On Board Time Performance ADA Trips Non-ADA Trips Total Trips On Board Time Performance 96.8% 98.2% 97.2% Total Trips 482,302 187,513 669,815 rides too long 18,139 3,981 22,064 7
Max On Board Time (ADA and non-ADA) Max On Board Time 97.7 97.6 97.5 97.4 97.3 97.2 97.1 97 January February March April May June Month YTD 8
2025 Year To Date KPI Data Trip Request Denials 2025 = 0 total one-way denials 2024 = 111 total one-way denials (almost exclusively in January) 2023 = 10,726 total one-way denials 9
Member Questions Question from last meeting: What other data points are tracked by MMSC: The list is very lengthy. Separate Handout Performance Standards are reviewed monthly for each provider. Demand Data Tracking are other areas also tracked for the Metro Mobility Service Going forward, the major Key Performance Indicators will be provided for TAAC Other Questions? 10


")

")

")