Mexico and China International Trade Analysis 1995-2020
This analysis compares the international trade structures of Mexico and China from 1995 to 2020, highlighting differences in economic performance, trade diversification, and GDP growth patterns. Mexico's reliance on free-market policies contrasts with China's strategic development approach. The content explores their exports, value-added content, GDP per capita, and global trade positions over different time periods.

Download Presentation

Please find below an Image/Link to download the presentation.
The content on the website is provided AS IS for your information and personal use only. It may not be sold, licensed, or shared on other websites without obtaining consent from the author. If you encounter any issues during the download, it is possible that the publisher has removed the file from their server.
You are allowed to download the files provided on this website for personal or commercial use, subject to the condition that they are used lawfully. All files are the property of their respective owners.
The content on the website is provided AS IS for your information and personal use only. It may not be sold, licensed, or shared on other websites without obtaining consent from the author.
E N D
Presentation Transcript
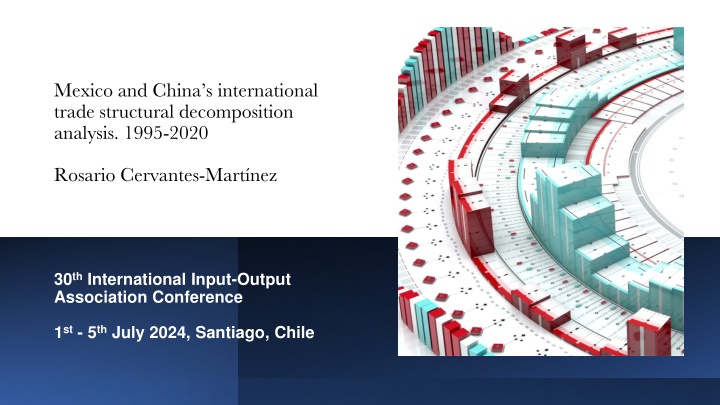
Mexico and Chinas international trade structural decomposition analysis. 1995-2020 Rosario Cervantes-Mart nez 30thInternational Input-Output Association Conference 1st- 5thJuly 2024, Santiago, Chile
Mexico and Chinas international trade structural decomposition analysis. 1995-2020 Gereffi (2009) and Shafaeddin & Pizarro (2010), among many other scholars, have documented well the differences between China and Mexico in terms of their economic performance over the last thirty years. While Mexico followed a textbook case of free-market policies, China engaged in a more strategic, statist approach to its development. As a result, in the case of the Mexican economy, there was a consistent pattern of low diversification of its exports and low domestic value-added content in its manufacturing exports (Fujii & Cervantes, 2013; De la Cruz et al ., 2011). In the case of China, there is a more diversified basket of exports accompanied by the development of supply-chain cities, the strategic attention to high-value activities, and its participation in the intra-regional trade and production networks in East Asia, Gereffi (2009, 48)
Mexico and Chinas international trade structural decomposition analysis. 1995-2020 18,000 Thousands 16,000 14,000 12,000 10,000 8,000 6,000 4,000 2,000 1960 1961 1962 1963 1964 1965 1966 1967 1968 1969 1970 1971 1972 1973 1974 1975 1976 1977 1978 1979 1980 1981 1982 1983 1984 - 1960 1962 1964 1966 1968 1970 1972 1974 1976 1978 1980 1982 1984 1986 1988 1990 1992 1994 1996 1998 2000 2002 2004 2006 2008 2010 2012 2014 2016 2018 2020 2022 China's GDP Mexico's GDP China's GDP Mexico's GDP
Mexico and Chinas international trade structural decomposition analysis. 1995-2020 China Mexico World 10.03 9.92 8.88 6.60 6.56 6.43 6.00 5.05 3.79 3.75 3.51 3.10 2.96 2.94 2.35 1.76 1.21 0.91 1961-1970 1971-1980 1981-1990 1991-2000 2001-2010 2011-2020
Mexico and Chinas international trade structural decomposition analysis. 1995-2020 GDP per capita 14,000 2,000 1,000 12,000 0 10,000 (1,000) (2,000) 8,000 (3,000) 6,000 (4,000) (5,000) 4,000 (6,000) 2,000 (7,000) - (8,000) 1960 1962 1964 1966 1968 1970 1972 1974 1976 1978 1980 1982 1984 1986 1988 1990 1992 1994 1996 1998 2000 2002 2004 2006 2008 2010 2012 2014 2016 2018 2020 2022 China Mexico Rest of the world Mexico (gap) China (gap)
Mexico and Chinas international trade structural decomposition analysis. 1995-2020 Method In value-added, for each vector of final demand f?, there is a unique total value-added vector by country and industry, va?, given a specific structure in the production system that includes production functions, and wage rates and profit margins: 1f?= V?L?f? va?= V?I A? In the multiplicative form, strucutral decomposition: (1) va = VL? 1f? 1+ V? 1 Lf? 1+ V? 1L? 1 f + V Lf? 1+ VL? 1 f + V? 1 L f + V L f (2)
Mexico and Chinas international trade structural decomposition analysis. 1995-2020 If we further decompose the final demand vector: va = VL? 1f? 1+ V? 1 Lf? 1+ V? 1L? 1 fdd+ V? 1L? 1 fed+ V? 1L? 1 fde+ V? 1L? 1 fee (3) + V Lf? 1+ VL? 1 f + V? 1 L f + V L f Where: 1. fdd, measures the changes in value-added allocation, given the changes in the domestic final demand supplied by the domestic economy, intermediate inputs imports. 2. fed, measures the changes in the imports of final goods and exports of intermediate inputs. 3. fde, measures the changes in the exports of final goods and intermediate inputs imports 4. fee, measures the changes in exports of intermefiate inputs, in the RoW final production and final demand.
China and Mexicos total trade in gross and value-added. 1995-2020 Mexico and China s international trade structural decomposition analysis. 1995-2020
China and Mexicos total trade in gross and value-added. 1995-2020 Mexico and China s international trade structural decomposition analysis. 1995-2020
Mexico and Chinas international trade structural decomposition analysis. 1995-2020 Final goods exports
Mexico and Chinas international trade structural decomposition analysis. 1995-2020 Intermediate inputs exports
Mexico and Chinas international trade structural decomposition analysis. 1995-2020 China Mexico 40.0 30.0 20.0 30.0 10.0 20.0 - 10.0 1996-2000 2001-2005 2006-2010 2011-2015 2016-2020 (10.0) - (20.0) 1996-2000 2001-2005 2006-2010 2011-2015 2016-2020 (30.0) (10.0) (40.0) (20.0) (50.0) (30.0) (60.0) AEEP _VA coefficients EPA_Vacoefficients AEEP _Leontief EPA_Leontief AEGM _VA coefficients GMA_Va coefficients AEGM _Leontief GMA_Leontief
Mexico and Chinas international trade structural decomposition analysis. 1995-2020 Mexico China 25.0 60.0 50.0 20.0 40.0 30.0 15.0 20.0 10.0 10.0 - 5.0 1996-2000 2001-2005 2006-2010 2011-2015 2016-2020 (10.0) (20.0) - 1996-2000 2001-2005 2006-2010 2011-2015 2016-2020 (30.0) AEEP_exports FG EPA_exports FG AEEP_exports II EPA_exports II AEGM_exports FG GMA_exports FG AEGM_exports II GMA_exports II
Mexico and Chinas international trade structural decomposition analysis. 1995-2020
Mexico and Chinas international trade structural decomposition analysis. 1995-2020 At the start of the period in 1960, China held a slight economic advantage over Mexico, with a total GDP of 158 907 million constant 2015 US Dollars, compared to Mexico's 152 253 million. From 1960 to 2022, Mexico's and China's economic performance showed remarkable differences. The per capita GDP in China was 238 dollars, and 4 198 dollars in Mexico. From 1961 to 1980, Mexico's economic growth rates were higher and more stable. Over the period, the export processing activities in China exhibited a higher share of DVA than the exports of the Global Manufacturing Activities, on average 76 vs. 43 percent. However, from 1990 to 2020, China s growth rates were much higher, so by 2021, its per capita GDP reached the Rest of the World s average. From 1995 to 2020, both countries had their highest export growth rates in gross value. In 2022, the average income in China was 11 560 vs. 10 077 in Mexico
Mexico and Chinas international trade structural decomposition analysis. 1995-2020 The Activities Excluding Global Manufacturing in Mexico tend to exhibit higher DVA shares than the Activities Excluding Export Processing in China (90 vs. 88 percent). The structural decomposition analysis shows that year by year, the relative importance of each variable in the decomposition undergoes significant shifts. Mexico receives 650 dollars for every 1,000 dollars of exports, and China gets 810 dollars in domestic value-added. China also adds more value to its intermediate input exports. Contrary to expectations, the average contribution of Chinese exports to its value- added change was lower than that of Mexican exports to its domestic value-added. Finally, the only decomposition element with a decrease was the one associated with the total requirements coefficient matrix. Export Processing Activities contribute a lower share of the Chinese economy's value- added change.
Mexico and Chinas international trade structural decomposition analysis. 1995-2020 Dra. Mar a del Rosario Cervantes Mart nez Full time professor Economics Department Centro Universitario de Ciencias Econ mico- Administrativas Universidad de Guadalajara mariac@cucea.udg.mx https://orcid.org/my-orcid?orcid=0000-0002-1524-0379 https://www.researchgate.net/profile/Rosario-Cervantes- Martinez