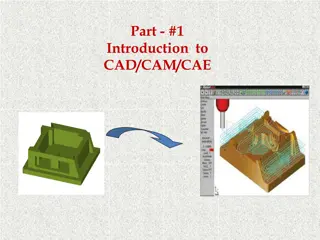
Micro:bit Application Development for Educational Graphing
"Join Team 6 in creating a Micro:bit application for educators and students, allowing data collection and graphing. Learn how to connect, graph data in real-time, download as CSV, and manipulate graphs. Explore features like point-of-interest hovering, zooming, and panning for an interactive experience."

Download Presentation

Please find below an Image/Link to download the presentation.
The content on the website is provided AS IS for your information and personal use only. It may not be sold, licensed, or shared on other websites without obtaining consent from the author. If you encounter any issues during the download, it is possible that the publisher has removed the file from their server.
You are allowed to download the files provided on this website for personal or commercial use, subject to the condition that they are used lawfully. All files are the property of their respective owners.
The content on the website is provided AS IS for your information and personal use only. It may not be sold, licensed, or shared on other websites without obtaining consent from the author.
E N D
Presentation Transcript
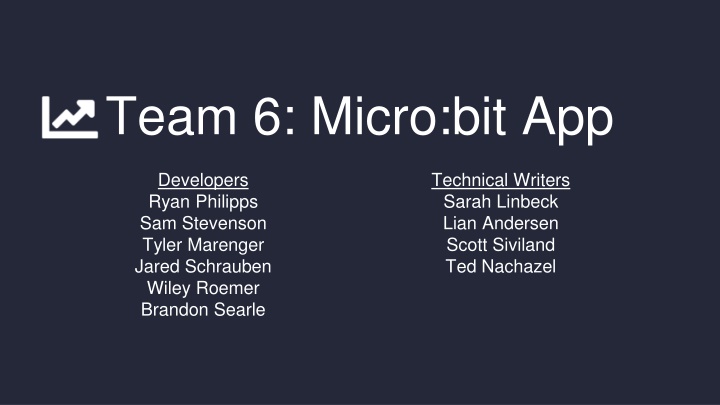
Team 6: Micro:bit App Developers Ryan Philipps Sam Stevenson Tyler Marenger Jared Schrauben Wiley Roemer Brandon Searle Technical Writers Sarah Linbeck Lian Andersen Scott Siviland Ted Nachazel
System and Users The Micro:bit application is a graphing application that uses a USB device known as a Micro:bit in order to collect data. The application supports several Micro:bit devices at once and displays the collected data on independent graphs which allow for data manipulation and saving (via downloading a CSV file). The intended audience for this application is educators and students in middle school and high school for educational purposes.
Application Demo When a user accesses the webpage they will be presented with this screen From here to user will connect and add their micro:bit using the Add Micro:bit button > Connecting a micro:bit will increment the counter This sticks to the page as the user scrolls
Application Demo Upon pressing the `Add Micro:bit` button, Chrome WebUSB will display Micro:bits available to connect as shown here > From here the user will select their Micro:bit(s) and then click connect
Application Demo For each Micro:bit connected, a unique graph will be generated Press `Play` to start graphing realtime data Press `Save` to download data as a CSV Press `Disconnect` to disconnect a Micro:bit from WebUSB Time elapsed while graphing is displayed
Application Demo After clicking play, the button will toggle to a `Pause` button The user can then press `Pause` to stop graphing data which can later be resumed
Application Demo Our graphs support point-of- interest hovering While hovering over the plot, the x-axis and y-axis values will be displayed Supports Zooming and Panning through the graph Zooming is done by using the bottom portion of the graph or using the scroll wheel Panning is accomplishing by using the bottom portion of the graph or dragging the cursor on the graph
Application Demo The bottom displays a chart which allows the user to view different ranges of data effectively Drag left or right Adjust size of range of data being displayed
Changes and Suggestions Our team is exploring options to change our graph naming convention The only unique identifier on the Micro:bits is the serial number, but we do not want to use this for each graph (due to the length) We are considering just incrementing the graphs from 1 (ie. Graph 1, Graph 2, ) The issue with this is it does not help the user identify which Micro:bit accompanies which graph Our team is also looking at ways to improve the visual aspect of the buttons and their positioning
Instructional Information Find the instructional document here: https://docs.google.com/document/d/1D3grMY1al05_76GEMyGy_MhFvsXQreGu WiZkM8oNhkE/edit?usp=sharing Included in the instructional document is both text instruction and screenshots with diagrams. This will be given to the test subjects so that improvements can be implemented afterwards.
Usability Concerns There can be a concern with the obtaining the actual microbit for using the application. This has been made evident from the current situation that we find ourselves in and the lack of available material. There is also the issue of the purley unending scope of the application. With the wide array of possible data inputs, there could be a chance to confuse the users. Finally, there could be an issue that you can only download the graph as a CSV, as people might need a PDF or a JPEG.
Moving forward Finished: Connecting Micro:bits via WebUSB Supports multiple Micro:bits When a Micro:bit is paired, it constructs a unique graph Save button downloads a CSV of data Graphs are prepared to receive data Panning, Zooming, and Hovering functionality Plan to Finish: Parse data from Micro:bit and feed to the graphs Allow the user to edit the name of the graph (if they desire to) Change graph naming convention Format CSV data Stretch Goals: Construct a UI which allows the user to combine graphs This will allow a plot to have multiple series lines