Microwave Remote Sensing for Land Surface Temperature Estimation
Explore how microwave remote sensing is utilized to estimate land surface temperature by measuring emissions from Earth's surface at longer wavelengths than infrared. This technology provides insights on emissivity, emitting temperature, spatial resolution, and cloud observations. Various sensors like SSM/I, SSMIS, AMSR-E, and AMSR2 are used for this purpose.

Download Presentation

Please find below an Image/Link to download the presentation.
The content on the website is provided AS IS for your information and personal use only. It may not be sold, licensed, or shared on other websites without obtaining consent from the author. If you encounter any issues during the download, it is possible that the publisher has removed the file from their server.
You are allowed to download the files provided on this website for personal or commercial use, subject to the condition that they are used lawfully. All files are the property of their respective owners.
The content on the website is provided AS IS for your information and personal use only. It may not be sold, licensed, or shared on other websites without obtaining consent from the author.
E N D
Presentation Transcript
Microwave LST_cci Product Carlos Jimenez, Catherine Prigent, Iris de Gelis Estellus, Paris Observatory ESA UNCLASSIFIED - For Official Use
Microwave remote sensing Microwave (MW) emission from the Earth s surface at much longer wavelengths than in the infrared (IR) can also be used to estimate the land surface temperature (LST). However, the energy emitted (E) is weaker and is less sensitive to changes on the emitting temperature (T). E ~ T4 E ~ T LSTcci UWS 12/2024 ESA UNCLASSIFIED - For Official Use
Microwave observations emissivity The radiant temperature (TR) has also a larger dependence on the emissivity (e), which has a larger variability than in the IR, changing with the surface conditions (e.g., the state of the vegetation, the soil moisture content). TR = eMW T TR = eIR1/4 T eIR[8.3um] eMW[19GHz-hpol] LSTcci UWS 12/2024 ESA UNCLASSIFIED - For Official Use
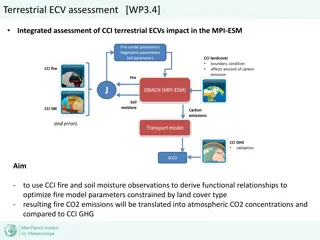
Microwave observations emitting temperature Longer wavelengths have larger penetration depth; in very arid places MWs observe a emitting temperature integrated over a few cms below the surface, differing from the skin temperature measured in the IR. emitting depth at 18 GHz Favrichon et al., 2021, https://doi.org/10.3390/ rs13071325 LSTcci UWS 12/2024 ESA UNCLASSIFIED - For Official Use
Microwave observations spatial resolution Weaker emission and longer wavelengths require large antennas, resulting in relatively large measurement footprints on the ground, in the order of tens of kms. ~25 km LSTcci UWS 12/2024 ESA UNCLASSIFIED - For Official Use
Microwave observations clouds At the observing MW window channels the land surface emission traverses most of the clouds, therefore LST can be estimated for most weather conditions and does not suffer from the clear-sky bias of the IR measurements. LSTcci UWS 12/2024 ESA UNCLASSIFIED - For Official Use
MW LST product sensors v2.33 MW LST ongoing SSM/I SSMIS Frequency & Resolution 19.35 GHz (73x47 km) 23.235 GHz (73x47 km) 37.0 GHz (41x31 km) 91.5 GHz (14x13 km) AMSR-E AMSR2 19.35 GHz (69x43 km) 23.235 GHz (50x40 km) 37.0 GHz (37x28 km) 85.5 GHz (15x13 km) 18.7 GHz (27x16 km) 23.8 GHz (32x18 km) 36.5 GHz (14x8 km) 89.0 GHz (6x4 km) 18.7 GHz (14x22 km) 23.8 GHz (15x26 km) 36.5 GHz (7x12 km) 89.0 GHz (3x5 km) Nominal Incident Angle 53o Swath width 1700 km Nominal Equator Crossing Local Time 6 am/pm Satellite Platform DMSP F17 Period 2008-2022 53o 55o 55o Radiances sourced from a CM-SAF MW Fundamental Climate Data Record (FCDR) of inter-calibrated brightness temperatures 1400 km 1450 km 1450 km 6 am/pm 1.30 am/pm 1.30 am/pm doi: 10.5676/EUM_SAF_CM/FCDR_MWI/V003 DMSP F13 Aqua GCOM-W1 1996-2008 2003-2011 2013-2022 LSTcci UWS 12/2024 ESA UNCLASSIFIED - For Official Use
MW LST product sensors The FX satellites do not have system to stabilize their orbits, so orbit injection and orbital drift affect the observing local time. F13 and F17 are selected to minimize the change in observing local time, and an optional LST correction to homogenize the record to a 6AM/PM overpass is also provided. F13 F17 1996-2020 LSTcci UWS 12/2024 ESA UNCLASSIFIED - For Official Use
MW LST product temporal-spatial resolution - LST under most cloudy conditions, but deep convective clouds identified and LST flagged out (surface radiation scattered away by ice cloud particles at 37 and 85 GHz). - FX polar satellites, so twice per day (~6 AM/ PM), with a sensor swath of ~ 1400 1700 km. 2006/06/06 SSM/I ~6AM LSTcci UWS 12/2024 ESA UNCLASSIFIED - For Official Use
MW LST product time coverage - Swath width resulting in coverage of ~50% at the equator (due to the ~2 days revisiting time), increasing toward the poles (overlapping swaths). MODIS 1.30AM coverage SSMIS 6AM coverage LSTcci UWS 12/2024 ESA UNCLASSIFIED - For Official Use
MW LST product uncertainty Larger than for the IR LST due to the more varying emissivity, with estimated uncertainty in the order of 2-4K. Comparison with station data can show larger differences, partly due to the terrain inhomogeneity at the ~25km resolution. Uncertainty 2010/01/01 6AM (K) simulated SSM/I footprint Evora LST station LSTcci UWS 12/2024 ESA UNCLASSIFIED - For Official Use
MW LST product Ongoing work Extending the data record to sample the LST diurnal cycle 4 times per day by processing the AMSR-E and AMSR2 radiances. Working on a downscaling method to offer a MW LST product at 5km resolution. example in Southern Ethiopia LSTcci UWS 12/2024 ESA UNCLASSIFIED - For Official Use
MW LST product Summary A 1996-2202 microwave LST data record of all-weather LST based on SSM/I and SSMIS observations is currently available, with: two estimates per day (6AM/6PM), spatial resolution of ~25 km, estimated uncertainties in the ~2-4 K range, daily coverage from 50 to 100% (lower in the tropics). https://dx.doi.org/10.5285/a7e811fe11d34df5abac6f18c920bbeb Currently working on: extending the time period to cover the more recent years, including AMSR-E and AMSR2 to sample the diurnal cycle 4 times per day a downscaling methodology to improve the spatial resolution. LSTcci UWS 12/2024 ESA UNCLASSIFIED - For Official Use