Millennial Trends in Community College Geosciences
Explore the changing landscape of community college geoscience education by analyzing data trends since 2013, including shifts in student demographics, interests, and learning behaviors. Discover insights on student backgrounds, course preferences, technological usage, and more to empower geoscience faculty in enhancing student learning experiences.
Download Presentation

Please find below an Image/Link to download the presentation.
The content on the website is provided AS IS for your information and personal use only. It may not be sold, licensed, or shared on other websites without obtaining consent from the author. If you encounter any issues during the download, it is possible that the publisher has removed the file from their server.
You are allowed to download the files provided on this website for personal or commercial use, subject to the condition that they are used lawfully. All files are the property of their respective owners.
The content on the website is provided AS IS for your information and personal use only. It may not be sold, licensed, or shared on other websites without obtaining consent from the author.
E N D
Presentation Transcript
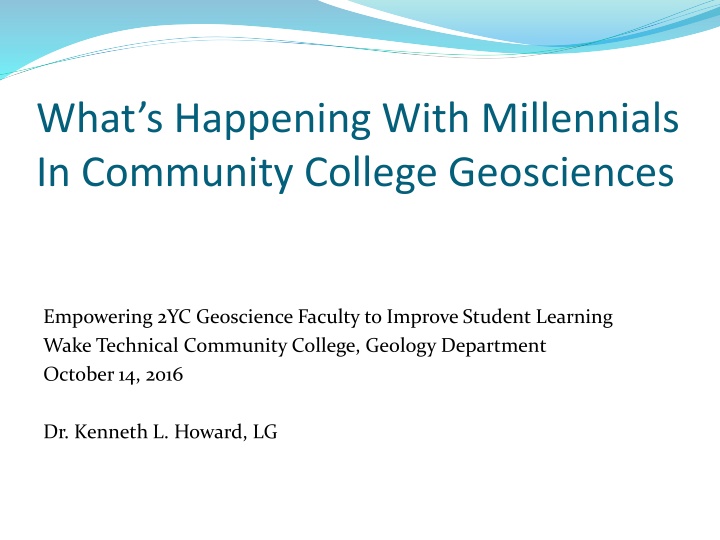
Whats Happening With Millennials In Community College Geosciences Empowering 2YC Geoscience Faculty to Improve Student Learning Wake Technical Community College, Geology Department October 14, 2016 Dr. Kenneth L. Howard, LG
Whats Our Demographic and How Do We Assess Science Outcomes Background Questionnaire Level of Scientific Literacy Ability to Solve a Logic Problem Testing and Assessment
Background Questionnaire Students are asked questions about their experience, educational background, interest, and views on a variety of topics including: Geoscience background, Past science courses, Use of the ILC (Individual Learning Center), Overseas travel, Sources of news and information, Interest level, and Course expectations. Data compiled from FA2007 through FA2016
Significant Results and Trends Data Show Significant Changes in Student Response in FA2013 Geoscience Background: Since FA2013, 91.4% of students report having taken an Earth Science unit in high school. Prior to that date only 81.0% reported such exposure. First College Science Course: Prior to FA2013, 44.5% of students were taking Geology as their first college science course. Since then the percentage has risen to 50.6%. Biology is the most common course already taken.
ILC Usage: Reported usage has declined sharply since FA2013 from 56.8% to 40.8%. Overseas Travel: Students who report overseas travel experience have dropped from 61.5% to 56.9% since FA2013. However, the period prior to FA2011 showed 65.7% overseas travel because of a high proportion of returning veterans. Sources of News: Students dominently obtain their news from internet, friends, and social media. Marked changes since FA2013 include; Network TV down 4.2%, Newspapers down 17.5%, Cable TV down 10.0%, and News Magazines down 10.5%. Internet Activity has remained quite uniform at 95.4%.
Student Interest Levels: Since SP2011, students have consistently reported taking geology to satisfy their science requirement at a very higher level than in previous years(88.4% versus 50.1%). In Fall 2012, a corresponding decrease in expressed interest in course content occurred (53.0% to the current level of 33.6%). Student Expectations: Throughout the survey period, students have reported expectations of A and B grades with less than 10 hours per week of expected effort.
Level of Scientific Literacy Science Literacy at Start of Course 80.0 75.0 70.0 65.0 Percent Correct Note increased level since 2013 60.0 Entry 55.0 50.0 45.0 40.0 F2009 SP2010 F2010 SP2011 F2011 SP2012 F2012 SP2013 F2013 SP2014 F2014 SP2015 F2015 SP2016 Semester
Ability to Solve a Logic Problem Students must arrange five statements in proper order from initial observation to conclusion. From Fall 2009 through Spring 2016, a total of 1027 students have been asked to solve the question. 28% have not been successful. 24.1% of those who fail withdraw versus 12.9% for those who find the correct sequence. Grade outcomes on tests over the semester average 8.86 points lower for students who fail the question than for those who place the choices in correct order.
Testing and Assessment Changes in Scientific Literacy (Pre- and Post-Test) Scientific Literacy Results by Science Common Objectives and Exam Questions
Changes in Scientific Literacy Science Literacy Entry vs. Exit 80.0 75.0 70.0 65.0 Percent Correct 60.0 Entry Exit 55.0 50.0 45.0 40.0 F2009 SP2010 F2010 SP2011 F2011 SP2012 F2012 SP2013 F2013 SP2014 F2014 SP2015 F2015 SP2016 Semester
Scientific Literacy Results by Science GEL 111/120 Change in Success Rate by Subject Start to End of Semester 40.0 35.0 30.0 Percentage Improvement 25.0 Geology 20.0 Biology Chemistry 15.0 Physics 10.0 5.0 0.0 FA09 SP10 SUM10 FA10 SP11 SUM11 FA11 SP12 SUM12 FA12 SP13 FA13 SP14 FA14 SP2015FA2015SP2016 -5.0
Common Objectives and Exam Questions The WTCC Geology Group tests for student outcomes on 12 course objectives during final exams and monitors long-term results. Other student learning outcomes are also being testing with on-line, topic specific quizzes, but data are still preliminary.
Common Exam Question Results Since Fall 2011, test scores on 8 objectives have fallen (5 15%), one objective has not changed, and three objectives have increased (1 3%). Students currently achieve 70% success on only 6 of the twelve objectives. LO #2 - Andes Mountains - down 11% 100% Bloom Level = Analyze 80% 60% 40% Fall 2010 Spring 2011 Fall 2011 Spring 2012 Fall 2012 Spring 2013 Fall 2013 Spring 2014 Fall 2014 Spring 2015 Fall 2015 Spring 2016
Ob6b2- Shield Volcanos - down 15% 100% Bloom Level = Understanding 80% Note decreasing scores since 2013 60% 40%
Ob14 - Geologic Hazard Risks - up 3% 100% Bloom Level = Evaluate Note increasing scores since 2013 80% 60% 40% Spring 2011 Fall 2011 Spring 2012 Fall 2012 Spring 2013 Fall 2013 Spring 2014 Fall 2014 Spring 2015 Fall 2015 Spring 2016
Summary of Observations Significant shifts in student demographics began in Fall 2013. These changes include: Most students have been exposed to Earth Sciences in high school. Scientific literacy test scores at entrance have increased slightly. Scores on common final exam questions have declined. Students have abandoned print media and television. Students appear to be younger and have not used ILC. Students have had less foreign travel exposure. Scientific Literacy results in Pre- and Post-test show increased student learning for materials taught in the course, but geology scores are still at <70% success level at the end of the semester. Common Objective and Exam Question results show a decline in student mastery of the basic elements of the course over time. Over 25% of entering students are unable to solve a simple logic problem. Those with poor logic skills are less likely to succeed.

