Mineral Stability Diagram Parameters and Setup
Explore the initial parameters and setup for creating a mineral stability diagram based on Ca++/H+^2 and K+/H+ ratios. Learn about staging, scanning paths, axis ranges, and variables formatting for accurate mapping.

Download Presentation

Please find below an Image/Link to download the presentation.
The content on the website is provided AS IS for your information and personal use only. It may not be sold, licensed, or shared on other websites without obtaining consent from the author. If you encounter any issues during the download, it is possible that the publisher has removed the file from their server.
You are allowed to download the files provided on this website for personal or commercial use, subject to the condition that they are used lawfully. All files are the property of their respective owners.
The content on the website is provided AS IS for your information and personal use only. It may not be sold, licensed, or shared on other websites without obtaining consent from the author.
E N D
Presentation Transcript
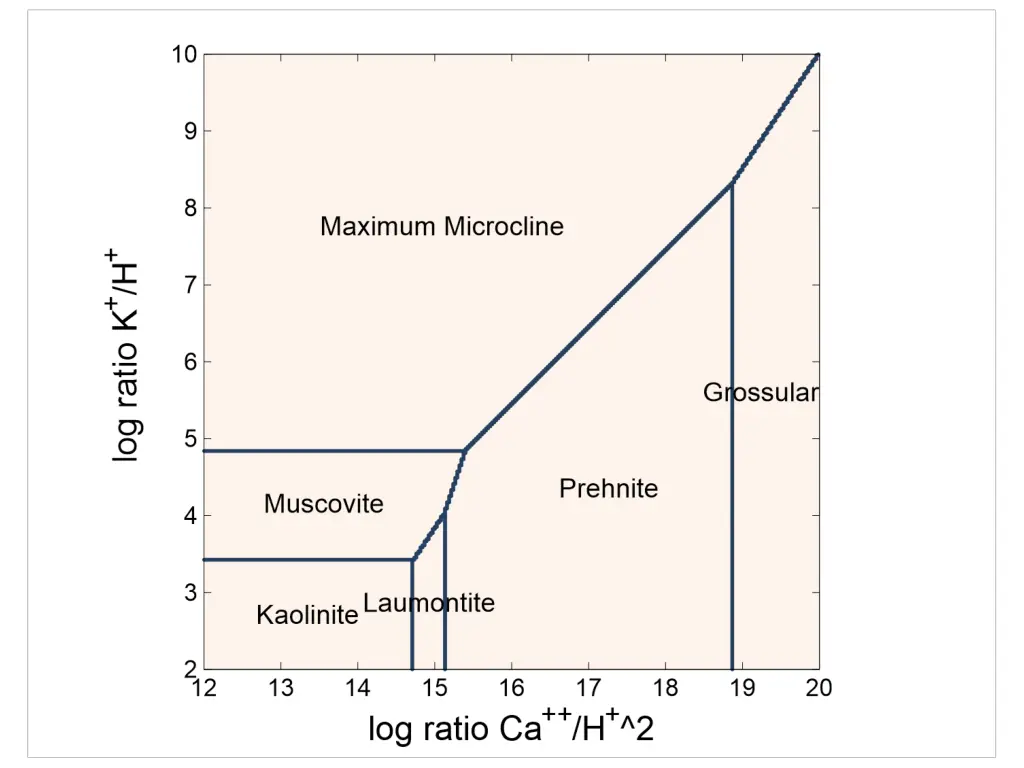
Initial parameters for Mineral Stability diagram The goal is to create a diagram of mineral stability based on the Ca++/H+^2 ratio and K+/H+ ratio
Setting up the staging and scanning paths On the X axis, log ratio of Ca++/H+^2 is set to slide to 20 On the Y axis, log ratio of K+/H+ is set to slide to 20
Format Axis Range and Variables
Format Predominance Map Select Basis species for Variable type and Al+++ for Variable to map