Mitigating Distributional Effects of COVID-19 in Andean Region
This study assesses tax-benefit policies' role in alleviating COVID-19 impacts on income distribution in Colombia, Ecuador, and Peru, focusing on changes in household disposable income and the effectiveness of social assistance programs.
Download Presentation

Please find below an Image/Link to download the presentation.
The content on the website is provided AS IS for your information and personal use only. It may not be sold, licensed, or shared on other websites without obtaining consent from the author.If you encounter any issues during the download, it is possible that the publisher has removed the file from their server.
You are allowed to download the files provided on this website for personal or commercial use, subject to the condition that they are used lawfully. All files are the property of their respective owners.
The content on the website is provided AS IS for your information and personal use only. It may not be sold, licensed, or shared on other websites without obtaining consent from the author.
E N D
Presentation Transcript
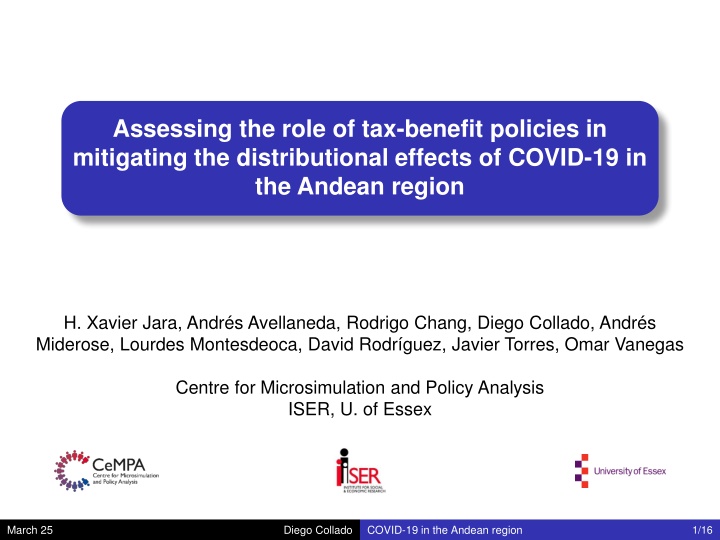
Assessing the role of tax-benefit policies in mitigating the distributional effects of COVID-19 in the Andean region H. Xavier Jara, Andr s Avellaneda, Rodrigo Chang, Diego Collado, Andr s Miderose, Lourdes Montesdeoca, David Rodr guez, Javier Torres, Omar Vanegas Centre for Microsimulation and Policy Analysis ISER, U. of Essex March 25 Diego Collado COVID-19 in the Andean region 1/16
Introduction This paper assesses the role of tax-benefit policies in mitigating the effects of the COVID-19 crisis on the distribution of household disposable incomes in Colombia, Ecuador and Peru. Before the crisis, these countries had low levels of social spending. Thus, it was likely that their benefit systems could not offer much protection. The pandemic brought a significant deterioration of labour market in 2020: unemployment climbed 3 pp, while the participation rates decreased by 10 pp (ECLAC, 2021). This was projected to increase poverty from 30% to 35% (ECLAC, 2020). A few studies have focused on the effect of expanded social assistance programmes in mitigating the distributional impact of COVID (Cuesta and Pico 2020; Lustig et al. 2020; Brum and de Rosa 2021; Huesca et al. 2021; Jara et al. 2021). They find: A large increase in poverty and inequality A limited effect of expanded social assistance, except in few countries (e.g. Brazil and Argentina). We focus on the role of tax-benefit systems as a whole Diego Collado March 25 COVID-19 in the Andean region 2/16
Earners relative to the working age population 0.60 0.56 0.55 0.55 0.54 0.54 0.52 0.51 0.50 0.50 0.50 0.48 0.48 0.47 0.47 0.45 0.47 0.45 0.44 0.43 0.40 0.38 0.37 0.35 0.35 0.34 0.32 0.31 0.30 Colombia Ecuador Per Diego Collado March 25 COVID-19 in the Andean region 3/16
Methodology Decomposition of changes in household disposable income disposable income pre = y t y + b y disposable income post = y t y + b y = I y t y + b y I y t y + b y I y t y + b y (policy changes) = I y t y + b y + I y t y + b y I y t y + b y (other changes) Bargain and Callan (2010) =I y I t y+ I b y I y t y + b y other changes = I y + I t y I t y (taxes as automatic stabilizers) + I b y I b y (benefits as automatic stabilizers) I y (earnings changes) Tasseva and Paulus (2020) Diego Collado March 25 COVID-19 in the Andean region 4/16
Data and tax-benefit simulations We start from representative household survey data covering the pre-pandemic period (Q4-2019) And nowcast the earnings distribution during the pandemic based on official surveys collected during 2020 (Q2 and Q4) We use the microsimulation models to simulate tax-benefit policies and household disposable income before and during the pandemic Table 1. Data sources and microsimulation models Period of data collection Q4 2019 May 2020 Q4 2020 Number of individuals 186,727 65,481 184,790 Microsimulation model Country Data source Gran Encuesta Integrada de Hogares (GEIH) COLMOD Colombia Dec. 2019 59,183 Encuesta Nacional de Empleo, Desempleo y Subempleo de Hogares Urbanos y Rurales (ENEMDU) ECUAMOD Ecuador May/June 2020 Dec. 2020 Q4 2019 Q2 2020 Q4 2020 37,406 30,636 28,599 27,614 27,191 Encuesta Nacional de Hogares (ENAHO) PERUMOD Peru Source: Own elaboration based on household surveys. Diego Collado March 25 COVID-19 in the Andean region 5/16
Methodology: Nowcasting The pandemic reduced the questionnaires and, in some cases, forced telephonic interviews. Data for 2020 in most cases only contains demographics and earnings. To overcome, we nowcast: modify 2019 information on earnings and labour market status to match 2020 information. Extensive margin: probability model to determine if a working individual in the 2019 database is predicted to have positive earnings in 2020. P(Earnings=1)= ( + Characteristics+ d2020+ Characteristics d2020) Prediction: characteristics multiplied by the coefficients plus a random component We move ranked individuals to match earners by industry and formality status Intensive margin: conditional on having predicted positive earnings, apply a percentage change in earnings between 2019 and 2020. We carry out this process for employees and self-employed workers independently. We calculate percent changes by industry and formality status ( % per cell ) Diego Collado March 25 COVID-19 in the Andean region 6/16
Nowcasting results Table B2. Comparison of earners in original 2020 and nowcasted 2020 data based on 2019 Colombia Observed-Q2 Nowcast-Q2 Observed-Q4 Nowcast-Q4 0.632 0.657 0.610 0.629 Share of male 0.428 0.427 0.485 0.463 Share of Self-employment 0.312 0.312 0.289 0.280 Share of Skilled Ecuador Observed-Q2 Nowcast-Q2 Observed-Q4 Nowcast-Q4 0.659 0.693 0.639 0.658 Share of male 0.360 0.364 0.440 0.397 Share of Self-employment 0.247 0.270 0.194 0.205 Share of Skilled Peru Observed-Q2 Nowcast-Q2 Observed-Q4 Nowcast-Q4 0.635 0.622 0.572 0.568 Share of male 0.452 0.451 0.451 0.434 Share of Self-employment 0.253 0.230 0.225 0.218 Share of Skilled Note: Skilled is defined as having education above secondary level. Source: Authors elaboration based on household surveys. Diego Collado March 25 COVID-19 in the Andean region 7/16
Covid-19 policies Colombia Per Ecuador Social assistance (monthly) Familias en Acci n (56% of median income) J venes en Acci n (39%) Colombia Mayor (19%) Ingreso Solidario (7%) Social assistance (once) Bono independiente, Bono rural and Bono familiar universal (124%) Bono Yo me quedo en casa (62% of median) Bono de Protecci n Familiar (42% in 2 payments) Not simulated: Extension of the annual declaration and payment of income tax for 2019, and the automatic refund of payments in excess of 2019. Partial early from (compulsory) private pension funds workers withdrew 25% of stock) Un. subsidy (<4 min. wages 2 min. wages 3 months) VAT return Tax on High pensions and High earners in Government Reduction in pension contribution from 16% to 3% for self-employed, 4% to 0.75% for employed. withdrawal (+3MM Diego Collado March 25 COVID-19 in the Andean region 8/16
Results Decomposition of changes in household disposable income Diego Collado March 25 COVID-19 in the Andean region 9/16
Results - Contributions to income changes by employment type Diego Collado March 25 COVID-19 in the Andean region 10/16
Results - Change in disposable income due to automatic stabilisers Diego Collado March 25 COVID-19 in the Andean region 11/16
Results - Change in income due to COVID policies in Colombia Diego Collado March 25 COVID-19 in the Andean region 12/16
Conclusions Average household disposable income fell dramatically in the second quarter of 2020: 25.7% in Colombia, 43% in Ecuador and 49.3% in Peru. Gini increased by 0.07, 0.133 and 0.126, while the poverty headcount by 19.3, 34.5pp and 36.5pp, respectively. As lockdowns relaxed, smaller drops in household income of 11.8% in Colombia, 18.2% in Ecuador and 21.9% in Peru. Shock larger at the middle (U-shaped) COVID-related policies mitigated the impact at the bottom to different extents across countries Increased mean disposable income of the first decile group by 26.1% in Colombia, 11.3% in Ecuador and 83% in Peru, during the second quarter of 2020. By contrast, automatic stabilizers cushion the income shock at the top (taxes and SIC). While social assistance programmes did not react automatically due to their design as proxy means-tested benefits. These results highlight the unpreparedness of current tax-benefit systems, the partial success of some countries and the lack of fiscal capacity of others Diego Collado March 25 COVID-19 in the Andean region 13/16
Future steps Adding AR, BO, CL, MX and UR to another paper Using 2020 Q4 and some 2020 Q2 surveys instead of nowcasting Diego Collado March 25 COVID-19 in the Andean region 14/16
Thank you Diego Collado March 25 COVID-19 in the Andean region 15/16
Results - The effect of the COVID-19 pandemic on income inequality and poverty The effect of the COVID-19 pandemic on income inequality and poverty Colombia Ecuador Peru Pre-COVID Total Total Pre-COVID Total Total Pre-COVID Total Total scenario change change scenario change change scenario change change Q2 Q4 Q2 Q4 Q2 Q4 Inequality 0.497 0.070 0.010 0.461 0.133 0.038 0.460 0.126 0.042 Gini 0.481 0.115 0.013 0.395 0.225 0.058 0.379 0.241 0.069 Theil Poverty 26.6 19.3 5.8 25.7 34.5 12.3 28.2 36.5 11.9 FGT0 (%) 10.0 13.2 3.1 9.6 25.5 7.2 13.1 25.6 8.9 FGT1 (%) Extreme poverty 6.9 14.1 2.7 9.2 31.3 8.5 13.6 29.6 9.9 FGT0 (%) 2.4 7.9 1.5 3.6 19.1 4.5 6.4 17.9 6.8 FGT1 (%) Note: poverty and inequality indicators are based on per capita household disposable income. The 2019 national poverty and extreme poverty lines are used in each country. Poverty changes are expressed in percentage points. Source: own calculations Diego Collado March 25 COVID-19 in the Andean region 16/16
Results - Decomposing the change in income inequality and poverty Decomposing the change in income inequality and poverty Colombia Q2 Ecuador Q2 Peru Q2 Colombia Q4 COVID- related policies effects COVID- related policies effects COVID- related policies effects Total COVID-related Other Total Other Total Other Total Other change policies effects effects change effects change effects change effects Inequality 0.070 -0.023 0.092 0.133 -0.012 0.144 0.126 -0.046 0.172 0.010 -0.019 0.029 Gini 0.115 -0.034 0.149 0.225 -0.013 0.238 0.241 -0.070 0.311 0.013 -0.036 0.049 Theil Poverty 19.3 -3.0 22.3 34.5 -0.7 35.2 36.5 -3.4 39.9 5.8 -3.4 9.2 FGT0 (%) 13.2 -3.5 16.7 25.5 -1.6 27.1 25.6 -6.3 31.9 3.1 -2.7 5.7 FGT1 (%) Extreme poverty 14.1 -3.9 18.0 31.3 -1.2 32.5 29.6 -7.0 36.6 2.7 -3.0 5.7 FGT0 (%) 7.9 -3.4 11.3 19.1 -2.0 21.2 17.9 -7.4 25.4 1.5 -1.7 3.2 FGT1 (%) Note: poverty and inequality indicators are based on per capita household disposable income. The 2019 national poverty and extreme poverty lines are used in each country. Poverty changes are expressed in percentage points. Source: own calculations Diego Collado March 25 COVID-19 in the Andean region 17/16
