Mobile Cloud Computing Model and Big Data Analysis for Healthcare Applications
Integrating mobile devices with cloud computing for healthcare applications, utilizing real-time biomedical signals for analysis and storage in healthcare cloud computing service. Discusses large-scale Cloudlet MCC model for reducing network delay and power dissipation, with a vision for future health information technologies and transformation of healthcare through advanced technologies.
Download Presentation

Please find below an Image/Link to download the presentation.
The content on the website is provided AS IS for your information and personal use only. It may not be sold, licensed, or shared on other websites without obtaining consent from the author.If you encounter any issues during the download, it is possible that the publisher has removed the file from their server.
You are allowed to download the files provided on this website for personal or commercial use, subject to the condition that they are used lawfully. All files are the property of their respective owners.
The content on the website is provided AS IS for your information and personal use only. It may not be sold, licensed, or shared on other websites without obtaining consent from the author.
E N D
Presentation Transcript
Mobile Cloud Computing Model and Big Data Analysis for Healthcare Applications Prof.Dr.H. Hami OZ L. A. Tawalbeh et al.: Mobile Cloud Computing Model and Big Data Analysis for Healthcare Applications
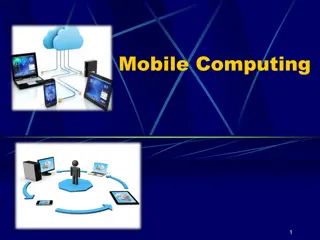
Mobile Cloud Computing Integrating the mobile devices with cloud com-puting to utilize the unlimited service provided by the cloud through the mobile device results in what is known as Mobile Cloud Computing [7]. Mobile Cloud Computing (MCC) is set to benefit many sec-tors including the cloud-healthcare systems. As an example, MCC healthcare system was built to capture and analyze real time biomedical signals (such as ECG and Blood pressure) from users in different locations. On the mobile device, a personalized healthcare application is installed and health data are being synchronized into the healthcare cloud computing service for storage and analysis [8].
Cloudlet MCC a large scale Cloudlet MCC model was deployed for the purpose of reducing network delay and power dis-sipation especially for intensive jobs such as multimedia applications. Also, the large scale deployment covering large areas allows the mobile users to stay connected with the cloud services remotely while they are moving within this area with less broadband communication needs while satisfying high quality service requirements
health information technologies The key health information technologies (HIT), according to them to be deployed over the next decade include Electronic Health Record (EHR), Personal Health Record (PHR), and Health Information Exchange (HIE) systems. They projected that by 2020, 80% of health care provider organizations will have implemented EHR systems in the US, and 80% of the general population will have started using PHR systems in the US. A vision of Medical Informatics in 2040 is presented in [27].
transformation of healthcare transformation of healthcare will be enabled through the implementation of technologies including genomic information systems & bio-repositories integrated with EHR systems; nanotechnology, advanced user interface solutions, e.g. wearable systems, health apps, health information exchange (HIE) with other industries/sectors such as pharma and manufacturing, Home-basedTeleHealth solutions interconnecting patients with health care providers, and medical robotic devices interfaced to health IT (HIT) systems.
HealthKit In 2014, Apple introduced the mobile health platform HealthKit [28], a cloudAPI made available for iOS 8 [29]. HealthKit benefits by theApple's partnership on this enterprise with Mayo Clinic and soft-ware company Epic Systems. The HealthKitAPI provides the users with an interface for accessing and sharing their PHRs
Apple Health The Apple Health app provides a convenient entry point to personal-ized health services. Apple has also provided information for developers and extended an invitation to discuss the possibilities for interaction of various devices with the sys-tem [30].
``S'' Health The ``S'' Health app from Samsung for Android platform is also being used by many people on their smart phones [31]. These are important milestones in the move towards personalized healthcare. Major innovations in personalized healthcare will begin when open Source community will start contributing in the healthcare applications space.
healthcare monitoring system A healthcare monitoring system based on wireless sensor networks is proposed in [34]. Specifically, the monitoring system monitors phys- iological parameters from multiple patient bodies through a coordinator node attached to the patient's body that col-lects the signals from the wireless sensors and sends them to the base station. Continuous monitoring of physiological parameters is an important application area of healthcare and has major implication on the design of network that con- nects sensors, analysis applications, physicians, healthcare systems and providers.
healthcare monitoring system For example, as exempli ed in this paper, monitoring of blood pressure and heart rate of a preg-nant woman, and the heart rate/movement of the fetus, is a vital requirement for managing her health. The sensors attached to a patient's body form a wireless body sensor network (WBSN) and provide information related to heart rate, blood pressure and other health related parameters.
healthcare monitoring system A framework for a uni ed middleware based on Session Initiation Protocol (SIP) to enable mobile healthcare appli-cations over heterogeneous networks is proposed in [35]. Their motivation is the need for anytime anywhere delivery of healthcare services that will in turn require operation over heterogeneous networks. Their approach is to use the proposed unified middleware to isolate applications from mobility management and other transport/discovery related tasks
HL7 In the context of networked healthcare we should men-tion the Health Level Seven International standard. HL7 is a not-for-profit organization that was formed in 1987. It is accredited byANSI (American National Standards Institute) and it is ``dedicated to providing a comprehensive framework and related standards for the exchange, integration, sharing, and retrieval of electronic health information that supports clinical practice and the management, delivery and evaluation of health services'' [40]. ``Level Seven'' refers to the seventh layer (the application layer) of the International Organization for Standardization (ISO) seven-layer communications model for Open Systems Interconnection (OSI).
IV. MOBILE CLOUD COMPUTING INFRASTRUCTURE FOR HEALTH CARE BIG DATA FIGURE 3. Mobile cloud computing traditional infrastructure.
V. DATA ANLAYTICS Data analytics science is divided into exploratory data analysis (EDA), confirmatory data analysis (CDA) and qualitative data analysis (QDA). In EDA new features in the data are dis-covered, in CDA existing hypotheses are proven true or false and QDA is being used in social sciences to draw conclusion from non-numerical data for example, photographs, videos or words
Daytona Developers developed a Cloud data analytics service which is based on Daytona. Daytona is an interactive MapReduce [61] runtime optimized for data analytics. In their model, Excel and other client application provide the data entry and other interaction interface to the user, and bridges the gap between the client and Cloud, user can use this service to discover and import data from the Cloud, invoke Cloud scale data analytics algorithms to extract information from big datasets, invoke data visualization and then store data back to the Cloud with the help of spreadsheet or any other client application to whom user is already familiar
Daytona This development is the ramp between any client application such as Excel and a new class of data analytics algorithms that are being implemented on Cloud. User only need to select an analytics algorithms from the Excel research ribbon with having concern for how to start up virtual machines in the Cloud or how to scale out the execution of selected algorithms in the Cloud.
VI. TOOLS FOR DATA ANALYSIS There are different tools available for data visualization and analysis [62], (i) DataWrangler is web based service from Stanford University'sVisualization Group and is designed for cleaning and rearranging data.
VI. TOOLS FOR DATA ANALYSIS (ii) Google Refine is explained as spreadsheet on steroids for taking a rst look at numerical and text data, it can import and export data in different formats which includes tab and comma separate text les and XML, Excel and JSON les.
VI. TOOLS FOR DATA ANALYSIS (iii) The R Project for statistical computing is a general statistical analysis plat-form which runs on command line. It also graphs, charts and plot results. This is open source project which signif- icantly extend functionality. It runs on Linux, Mac OS X, Windows XP or later and Unix.
VI. TOOLS FOR DATA ANALYSIS (iv) Google FusionTables, is one of the simplest way to turn data into chart or map. File could be uploaded in several different formats and then choose how to display it, for example in form of table, map, line chart heatmap, bar graph, pie chart, timeline, scatter plot, motion or storyline. It also provide option to enable others to make comments on the data itself. Google FusionTables could run on any web browser.
VI. TOOLS FOR DATA ANALYSIS (v) Impure, is likeYahoo Pipes for data visualization and it is designed for creating various types of highly polished graphical representations of data by using a drag and drop workspace. This tool provide highly visual interface for creating visualization, and it run on any web browser.
VI. TOOLS FOR DATA ANALYSIS Another tool, (vi) Tableau Public, can turn data into any number of visualization, for example from simple to complex. User can drag and drop les onto the work area and get help from the software for suggesting visualization type and then customize everything, for example, labels and tool tips to size, legend display and interactive lters. This tool runs on Windows 7, Vista, XP, Server 2008, 2003
VI. TOOLS FOR DATA ANALYSIS (vii) Many Eyes, is a pioneer in web-based data visualization, IBM's Many Eyes project combines graphical analysis with community and encourage user to upload share and discuss information. This tool is easy to use and have well documentation which gives suggestion on when to use what kind of visual data rep-resentation. More than a dozen output options are available for example, graphics and word clouds, treemap, charts, plots and network diagrams. A free account is required to upload and post data. This tool can run on Java and any modern Web browser which can display Flash.
VI. TOOLS FOR DATA ANALYSIS (viii) VIDI, the web site of VIDI's bills this as a tool for Drupal content management system. No Drupal is required when graphics created by the site, visualization wizard can be used on any HTML page. This tool is easy in use just like Many Eyes which have more mapping options. VIDI can run on any web browser.
VI. TOOLS FOR DATA ANALYSIS Zoho Reports, this tool can take data from number of le formats or directly from a database and then turn it into tables, charts and pivot tables and other formats which are familiar to spread sheet users. User can schedule data imports from source on the web. This tool can run on any web browser.
VI. TOOLS FOR DATA ANALYSIS Choosel, this tool is currently under development and is a open source web based framework which is designed for charts, graphs, clouds, maps and timelines. Choosel can run on Safari, Chrome, and Firefox.
VI. TOOLS FOR DATA ANALYSIS A tool called Exhibit (xi) is developed for users to easily create web pages with advanced text search functionalities. Users who are comfortable with coding, Exhibit offer them number of views for example, charts, maps, timeplots, and calendars
VI. TOOLS FOR DATA ANALYSIS (xii) Google Chart Tools, is a full edge self-contained application for uploading and sorting data, and also generating maps and charts. It runs on any web browser.
VI. TOOLS FOR DATA ANALYSIS (xiii) JavaScript InfoVisToolkit, this is not among the best known JavaScript visualization libraries but White House agrees that it was used to create the Obama administration's interactive budget graphic. This tool runs on JavaScript-enabled web browsers.
VI. TOOLS FOR DATA ANALYSIS (xiv) Protovis, is a graphical toolkit for turning data into visualization. The best thing about this toolkit is that it is well documented with number of examples and sample code, and also this toolkit is designed to balance simplicity with control over the display. It runs on JavaScript-enabled web browsers.
VI. TOOLS FOR DATA ANALYSIS (xv) Quantum GIS (QGIS), this tool is designed for creating maps that offer sophisticated, detailed data base analysis of geographic regions. ArcView is an application which cost money but the open source QGIS is an alternative forArcView. QGIS runs on Linux, Mac OS X, Unix, Windows. (xvi) OpenHeatMap is user friendly website that generate colour coded maps. Color will change depending on the underlying information for example, population or average income change. It runs on web browsers enabled for ash or HTML 5 Canvas.
VI. TOOLS FOR DATA ANALYSIS OpenLayers, is JavaScript library for displaying map information. It works with OpenStreetMap. This is not developed yet but the project page says that it is still undergoing rapid development.
VI. TOOLS FOR DATA ANALYSIS OpenStreetMap (xviii) is somewhat like Wikipedia of mapping world. It runs on any web browser
VI. TOOLS FOR DATA ANALYSIS (xix) TimeFlow, is desktop software is being used for analysing data points which involve a time component. This software allows to the use to store and lter information and give get statistical summaries of the data. It runs on desktop systems running Java 1.6, Windows and Mac OS X.
VI. TOOLS FOR DATA ANALYSIS (xx) IBM Word-Cloud Generator, different tools mentioned in previous sections are able to create word clouds, for example, Many Eyes and the Google VisualizationAPI, but if the user is looking for easy desktop software dedicated to the task then IBM's freeWord Cloud is the an option. It runs on Mac OS X, Windows and Linux running Java.
VI. TOOLS FOR DATA ANALYSIS (xxi) Gephi, is photo shop for data and this open source beta project is designed for visualizing statistical information, for example relationship within the networks of 50,000 devices, it is used for network analysis. It runs on Windows, Linux, Mac OS X running Java 1.6.
VI. TOOLS FOR DATA ANALYSIS NodeXL is Excel plugin and displays network graph from a given list of connection. It help to analyse and see the patterns and relationships in the data. It runs on Excel 2007 and 2010 Windows.
VI. TOOLS FOR DATA ANALYSIS Talend Open Studio for Big Data [63] is an open source vendor for data analytics it provide all you need to easily design and implement big data transfer and big data analytics by using Hadoop technologies [64]. With this feature rich open source solution user can quickly get to work with big data and Hadoop. Talend is one of the largest companies with an open source business model. It was founded in 2005 and it's the rst commercial open source vendor of data integration software.
VI. TOOLS FOR DATA ANALYSIS Another open source tool for data analytics is called Weka [65] which is a collection of machine learning algo-rithms for data mining. These algorithms cloud be called from a java code or directly applied to a dataset. Weka pro-vide tools for data pre-processing, regression, classification, clustering, visualization and association rules.
VI. TOOLS FOR DATA ANALYSIS Another tool called RapidAnalytics [66] is open source and is one of most widely used data mining and predictive analysis solutions worldwide, it is built around RapidMiner which is a powerful engine for data analytics. It relys on industry standard application servers. User can remotely schedule execution of analytical processes. It also offer web based access to results, reports and processes that built on industry standard application and web services. It combines the advantages of RapidMiner with collaborative working environment and dedicated computing power
VI. TOOLS FOR DATA ANALYSIS During the process the user is assisted with (i) meta data propagation, it means no more trial and error but real time inspection. (ii) on the error detection, (iii) quickfixes, (iv) profiler, means that RapidMiner can continuously mon- tor the storage and runtime behaviour of analysis process in the background. (v) community extension, (vi) recommender, intelligent discovery assistant, (viii) MLWizard, this assistant concentrate on the generation of optimal classification processes for a given dataset. RapidMiner provides various chart and visualization options
VII. CONCLUSION An important trend to enable next generation networked healthcare systems would be the networking and integration of healthcare and other smart city systems. Networked healthcare systems will eventually be designed as sustainable enterprise systems which will be part of networked smart city.
