Mobilizing Financial Resources for Inclusive Growth in Nigeria: Strategies and Policy Options
This presentation by Professor Olufemi Taiwo explores conceptual issues, the global context, and strategies for achieving inclusive growth in Nigeria. It discusses the evolution of development strategies, financing options, challenges, and recommendations.
Download Presentation

Please find below an Image/Link to download the presentation.
The content on the website is provided AS IS for your information and personal use only. It may not be sold, licensed, or shared on other websites without obtaining consent from the author.If you encounter any issues during the download, it is possible that the publisher has removed the file from their server.
You are allowed to download the files provided on this website for personal or commercial use, subject to the condition that they are used lawfully. All files are the property of their respective owners.
The content on the website is provided AS IS for your information and personal use only. It may not be sold, licensed, or shared on other websites without obtaining consent from the author.
E N D
Presentation Transcript
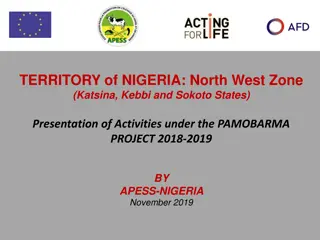
See full size image MOBILIZING FINANCIAL RESOURCES FOR INCLUSIVE GROWTH IN NIGERIA: STRATEGIES AND POLICY OPTIONS Professor Olufemi Taiwo Director-General Nigerian Institute of Social and Economic Research (NISER) (dg@niser.gov.ng; iotaiwo2003@yahoo.com) Presentation at the National Institute for Legislative Studies (NILS) Public Seminar Series, Abuja, April 20, 2015 See full size image
See full size image Outline 1. Introduction 2. Conceptual Issues 3. The Global Context 4. Rationale for Inclusive Growth in Nigeria 5. Strategies and Policies for Inclusive Growth in Nigeria 6. Financing Inclusive Growth 7. Challenges and the Way Forward See full size image 8. Conclusion and recommendations 2
See full size image 1. Introduction Evolution of Development Strategy in Nigeria: Fixed Medium-Term Plans Structural Adjustment Programme Rolling Plans NEEDS, SEEDS and LEEDS Nigeria Vision 20:2020, 1st NIP and the Transformation Agenda Objectives of the Presentation: To provide the raison d etre for inclusive growth in Nigeria. To proffer appropriate strategies and policies for inclusive growth in Nigeria. To identify financing options for inclusive growth See full size image 3
See full size image 2. Conceptual Issues Inclusive Growth Inclusive growth as a process that enhances benefit sharing and participation [Ranieri and Ramos, 2013, IPC-IG]. Inclusive growth is where the gap between the rich and the poor is less pronounced and the growth dividend is shared in a fairer way that results in improvements in living standards and outcomes that matter for people s quality of life [OECD Secretary General, Angel Gurria]. Inclusive growth means growth with equal opportunities. It therefore focuses on both creating opportunities and making the opportunities accessible to all [Ali and Zhuang, 2007, Asian Development Bank]. See full size image 4
See full size image 2. Conceptual Issues Inclusive Growth Inclusive growth focuses on both the pace and pattern of growth. It has a longer term perspective; therefore, it is concerned with sustainable growth and the focus is on productive employment rather than on direct income distribution [World Bank, 2009]. Inclusive growth refers to both the pace and distribution of economic growth [Anand, Tulin and Kumar, 2014, IMF]. Growth is defined as inclusive if it increases the social opportunity function that depends on: (i) average opportunity available to the population; and (ii) how opportunities are shared among the population [Ali and Son, 2007]. See full size image 5
See full size image 2. Conceptual Issues Pro-Poor Growth Growth is clearly pro-poor when it raises the incomes of the poor. There is less clarity on how much the income of the poor needs to rise for growth to be defined as pro-poor, and how this increase should be measured [ODI, 2008]. Absolute Any growth episode during which there is a drop in the poverty rate [Ravallio and Chen, 2003]. Inclusive growth is growth that leads to significant poverty reduction [Habito, 2009]. See full size image 6
See full size image 2. Conceptual Issues Pro-Poor Growth Relative Pro-poor growth requires that poor people s share of incremental income exceeds their current share of income [White and Anderson, 2001] One that enables the poor to actively participate in and significantly benefit from economic activity [Kakwani and Pernia, 2000]. Pro-poor growth requires that absolute increases in the income of the poor are larger than absolute increases in the income of the wealthier [Grosse et al., 2008]. See full size image 7
See full size image 2. Conceptual Issues Sustainable Development Sustainable development is development that meets the needs of the present without compromising the ability of future generations to meet their own needs [Brundtland Report, Our Common Future, 1987]. Sustainable development involves the simultaneous pursuit of economic prosperity, environmental quality and social equity [World Business Council on Sustainable Development, 2004]. A transition to sustainability involves moving from linear to cyclical processes and technologies. The only processes we can rely on indefinitely are cyclical [Karl Henrik-Robert]. See full size image 8
See full size image 2. Conceptual Issues Sustainable Development A sustainable society is one that can persist over generations, one that is far-- seeing enough, flexible enough, and wise enough not to undermine either its physical or its social systems of support [Donella Meadows, et.al., 1992]. to improve the quality of life while living within the carrying capacity of ecosystems [IUCN, The World Conservation Union, 1991]. "a means of planning and taking actions to change or strengthen values, knowledge, technologies and institutions" [Carew-Reid et al.1994]. "a co-ordinated set of participatory and continuously improving processes of analysis, debate, capacity- strengthening, planning and investment, which integrates the economic, social and environmental objectives of society, seeking trade offs where this is not possible" [OECD, 2001]. See full size image 9
See full size image 2. Conceptual Issues Sustainable Development "SD strategies cannot be implemented like a plan , but need flexible approaches on the government side with at the same time firm and accountable objectives, and ideally also quantitative targets" [EEAC, 2005]. The Centre for Environment Education summarizes sustainable development to possess the following features: A desirable human condition; An enduring ecosystem condition; and A balance between present and future generations; and within the present generation . See full size image 10
See full size image 3. The Global Context During 1961-2013, the world economy grew each year except in 2009 (Chart 1). There were significant variations in economic growth between major income groups (Chart 2): Middle income economies constitute the only group where economic growth occurred each year. The world also enjoyed a significant increase in HDI irrespective of level of human development and region (Tables 1 and 2). Also on a positive note, the poverty headcount reduced from 36.4 percent in 1990 to 14.5 per cent in 2011 (Chart 3). See full size image 11
See full size image 3. The Global Context However, the poverty headcount ratio at $1.25 a day remains high in low income countries (Table 3): Income inequality is also pronounced even in relatively advanced economies: In OECD, the Gini coefficient has been rising since the mid 1980s and now hovers around 31 per cent (Chart 4). Income inequality is worsening in many countries that are experiencing economic growth (Chart 5). See full size image 12
See full size image 3. The Global Context Chart 1: Trends in World GDP Growth, 1961-2013 (Annual %) 8.0 7.0 6.0 5.0 4.0 Percentage 3.0 2.0 1.0 0.0 -1.0 See full size image -2.0 -3.0 Year Source: The World Bank, WDI Database 13
See full size image 3. The Global Context Chart 2: Trends in GDP Growth by Income Group, 1961-2013 (Annual %) 10 8 6 4 Percentage 2 0 -2 -4 -6 See full size image Year Low Income Middle Income High Income Source: The World Bank, WDI Database 14
See full size image 3. The Global Context Table 1: Trends in Human Development Index by HDI Group, Selected Years HDI Group 1980 1990 2000 2010 2013 Very high human development 0.757 0.798 0.849 0.885 0.890 High human development 0.534 0.593 0.643 0.723 0.735 Medium human development 0.420 0.474 0.528 0.601 0.614 Low human development 0.345 0.367 0.403 0.479 0.493 Least Developed Countries 0.319 0.345 0.391 0.472 0.487 See full size image World 0.559 0.597 0.639 0.693 0.702 15 Source: UNDP, Human Development Reports
See full size image 3. The Global Context Table 2: Trends in Human Development Index by Region, Selected Years Region 1980 1990 2000 2010 2013 Arab States 0.492 0.551 0.611 0.675 0.682 East Asia and the Pacific 0.457 0.517 0.595 0.688 0.703 Europe and Central Asia .. 0.651 0.665 0.726 0.738 Latin America and the Caribbean 0.579 0.627 0.683 0.734 0.740 South Asia 0.382 0.438 0.491 0.573 0.588 See full size image Sub-Saharan Africa 0.382 0.399 0.421 0.488 0.502 16 Source: UNDP, Human Development Reports
See full size image 3. The Global Context Table 3: Poverty Headcount Ratio for Nigeria and Groups of Countries (%) Country/Group Year Poverty Headcount Ratio (%) Nigeria 2010 62.0 Low Income Countries 2011 46.8 Middle Income Countries 2011 13.7 Sub-Saharan Africa 2011 46.8 See full size image Source: The World Bank, WDI Database 17
See full size image 3. The Global Context Chart 3: Trends in World Poverty Headcount Ratio, 1990-2012 (% of Population) 40 35 30 Percentage of the Population 25 20 15 10 5 See full size image 0 1990 1993 1996 1999 2002 2005 2008 2010 2011 Year 18
See full size image 3. The Global Context Chart 4: Trends in Gini Coefficient for OECD Countries, Selected Years 32 31 30 Percentage 29 28 27 See full size image 26 1985 1990 1995 2000 2007 2010 2011 Year Source: The World Bank, WDI Database 19
See full size image 3. The Global Context Chart 5: Percentage Change in Gini Coefficient for Countries with the Highest Average Annual GDP Growth, 1980-2012 China 27.1 Indonesia 25.2 Lao PDR 19.0 Sri Lanka 12.1 Botswana 11.5 Nigeria 11.0 Ethiopia 3.6 Uganda 0.4 Vietnam -0.2 India -4.2 Malaysia -5.0 Thailand -12.9 See full size image -15.0 -10.0 -5.0 0.0 5.0 10.0 15.0 20.0 25.0 30.0 Percentage Change Source: The World Bank, WDI Database Note: Limited to countries for which information on Gini coefficient is available. 20
See full size image 3. The Global Context Why do we have high poverty incidence in Low Income Countries and growing income inequality worldwide? Low income countries are characterized by low level equilibrium, which leads to all kinds of capacity challenges. With regard to inequality, we have: Philosophical Issues: predominance of the free market system Focus of theories of economic growth on aggregate behaviour: Exogenous growth theories [e.g. Solow-Swan model Solow (1956), Swan (1956)] Endogenous growth theories [e.g. Romer (1990) and Howitt (1999, 2000)] Recent prominence of social policy: Pro-poor growth, broad-based growth, Inclusive growth Inclusive growth has been embraced by a number of developing economies and development partners. See full size image 21
See full size image 4. Rationale for Inclusive Growth in Nigeria Time series data for the period 1960-2013 show that Nigeria s economic growth has been modest, at an average annual rate of 3.8 per cent (Chart 6 and Table 4). In the 1960s, economic growth was less than the long-run average, at 2.4 per cent, due largely to the effects of the civil war of 1967-70. The oil boom of the 1970s gave fillip to economic growth in Nigeria, at an average rate of 4.8 per cent. The Nigerian economy declined in the 1980s, at the rate of 2.3 per cent, due to the debt crisis that prevailed during the period. See full size image 22
See full size image 4. Rationale for Inclusive Growth in Nigeria Economic growth was stunted in the 1990s, as the economy grew at the rate of 1.5 per cent. The 2000-2009 decade was unique because for the first time, the Nigerian economy grew rapidly over a relatively long period of time, at an average rate of 9.0 per cent. Economic growth during this decade was propelled by rise in crude oil prices, wholesale and retail trade, agriculture and ICT. Economic growth in Nigeria has declined since 2010 but at about the rate that prevailed in the 1970s, at 4.9 per cent. See full size image 23
See full size image 4. Rationale for Inclusive Growth in Nigeria Economic growth in Nigeria has not resulted in poverty reduction, improvement in the distribution of income and significant reduction in aggregate unemployment rate. The poverty headcount ratio rose from 54.05 per cent in 1986 to 62.03 per cent in 2010 (Table 5). The poverty headcount ratio higher in rural areas than in urban areas: Rural 69.0%, Urban 51.2% [2010, at national poverty line][NBS] Rural 52.8%, Urban 34.1% [2010, at national poverty line][World Bank, WDI]. See full size image 24
See full size image 4. Rationale for Inclusive Growth in Nigeria The Gini coefficient rose from 38.68 per cent to 42.95 per cent during the same period (Table 5). The income share of the Top 10 percentile of the population rose from 28.21 per cent in 1986 to 32.87 per cent in 2010 (Table 6). CPIA Gender equality rating for Nigeria (1 Low to 6 High][World Bank, WDI: 3 Aggregate unemployment rate rose from 13.1 per cent in 2000 to 24.2 per cent in 2012 (Table 7). Youth unemployment is more acute than the national average, at 31.7 per cent in 2012. See full size image 25
See full size image 4. Rationale for Inclusive Growth in Nigeria Government Response Several initiatives at all tiers of Government, such as: NEEDS: Policy Goals: Wealth Creation, Employment Generation, Poverty Reduction and Value Reorientation. Strategies: Empowering People, Promoting Private Enterprise and Changing the Way the Government Does its Work. National Directorate of Employment (NDE) Programme Skills Acquisition Scheme Entrepreneurship Scheme See full size image Enterprise Creation Scheme 26
See full size image 4. Rationale for Inclusive Growth in Nigeria Government Response Subsidy Reinvestment and Empowerment Programme (SURE- P): Empowerment of unemployed graduates One- year internship placement Peer networks for empowering other unemployed graduates. Safety Net Programmes at Federal and Subnational Levels, such as (Table 8): Unconditional cash transfer School feeding programmes Price subsidies Urban mass transit See full size image 27
See full size image 4. Rationale for Inclusive Growth in Nigeria Chart 6: Nigeria: GDP Growth, 1960-2013 (Annual %) 40.0 30.0 20.0 Percentage 10.0 0.0 -10.0 -20.0 See full size image Year Source: The World Bank, WDI Database 28
See full size image 4. Rationale for Inclusive Growth in Nigeria Table 4: Nigeria GDP Growth (%) Simple Average Cumulative Average Period 1960-69 2.9 2.4 1970-79 7.0 4.8 1980-89 -1.4 -2.3 1990-1999 2.6 1.5 2000-2009 8.9 9.0 2010-2013 5.6 4.9 Overall Average 4.1 3.8 See full size image Source: World Bank, WDI Database 29
See full size image 4. Rationale for Inclusive Growth in Nigeria Table 5: Nigeria: Poverty Headcount Ratio and Gini Coefficient, Selected Years Poverty Headcount Ratio (%) Gini Coefficient (%) Year 1986 54.05 38.68 1992 61.90 44.95 1996 68.65 46.50 2004 61.84 40.00 2010 62.03 42.95 See full size image Source: The World Bank, WDI Database 30
See full size image 4. Rationale for Inclusive Growth in Nigeria Table 6: Nigeria: Income Shares (%) 1992 1996 2004 2010 Percentile 1986 Top 10% 28.21 31.53 37.1 29.88 32.87 Top 20% 45.01 49.37 52.11 46.07 48.93 Lowest 20% 6.02 4.00 5.00 5.63 5.39 Lowest 10% 2.47 1.42 1.89 2.19 2.17 See full size image Source: The World Bank, WDI Database 31
See full size image 4. Rationale for Inclusive Growth in Nigeria Table 7: Unemployment In Nigeria Aggregate Unemployment Rate (%) Youth Unemployment Rate (%) Year - - - - - - - - - - 2000 2001 2002 2003 2004 2005 2006 2007 2008 2009 2010 2011 2012 13.1 13.6 12.6 14.8 13.4 11.9 12.3 12.7 14.9 19.7 21.1 23.9 24.2 28.7 32.2 31.7 See full size image Source: NBS, Labour Force Statistics 32
See full size image 4. Rationale for Inclusive Growth in Nigeria Table 8: Safety Net Programmes in Nigeria SSN Programmes being implemented by the Federal Government List of Social Safety Nets (SSN) Programmes I mplemented at the Subnational Level S/N 1 Unconditional cash transfer Conditional cash transfer In-kind general transfer (Supplementary feeding programme for mal nourished people) - Care of the Poor (COPE) 2 3 - 4 In-kind school transfer - School feeding - School supplies - UBE 5 Price subsidies- food, public transport Urban mass transit, maternal and chil d health services 6 Public works Fee waivers and exemptions Medical aids Old age allowance Allowance for widowed Unemployment allowance Public works Maternal and child health services HIV/AIDS programmes - - NDE 7 See full size image 8 9 10 11 33
See full size image 5. Strategies and Policies for Inclusive Growth in Nigeria The Strategies Rise in Aggregate Investment Based on the observation that the poverty headcount ratio is significantly higher in Low Income Countries and that economic growth is important to lift this class of countries from their low income status. Programming of the Structure and Productivity of Investment Which factors are most important for economic growth and income distribution? Important to integrate equity issues with efficiency issues rather than treating them separately. Social Protection Programmes See full size image Markets, institutions and policies are unlikely to eliminate completely vulnerable groups of people. 34
See full size image 5. Strategies and Policies for Inclusive Growth in Nigeria Rise in Aggregate Investment Share of gross fixed capital formation in GDP lower in Nigeria than in the rest of the world (Table 9) In 2013, share of gross fixed capital formation in GDP (In per cent): Nigeria: 14.5 Low Income Countries: 25.1 World: 21.9 Some room for rise in aggregate investment See full size image 35
See full size image 5. Strategies and Policies for Inclusive Growth in Nigeria Rise in Aggregate Investment Public Sector Prioritization of capital expenditure This will be difficult to achieve without substantial increase in public revenue In the short-run, a boost in public revenue can be achieved through reduction in oil theft, gas flaring and other sharp practices. Private Sector Provide basic infrastructure (electricity, water, roads, etc.) to support private investment Improve the regulatory framework for the financial and capital markets See full size image Rationalize cost of borrowing to single digit 36
See full size image 5. Strategies and Policies for Inclusive Growth in Nigeria Table 9: Share of Gross Fixed Capital Formation in GDP in Nigeria and the Rest of the World, 2010-2013 (%) Country/Group 2010 2011 2012 2013 Nigeria 17.0 16.0 14.6 14.5 Low Income Countries 24.0 24.6 24.8 25.1 Middle Income Countries 29.4 29.6 29.9 29.9 World 21.6 21.8 22.0 21.9 Source: The World Bank, WDI Database Nigeria 17.0 16.0 14.6 14.5 See full size image Source: NBS, Rebased GDP 37
See full size image 5. Strategies and Policies for Inclusive Growth in Nigeria Programming of the Structure and Productivity of Investment Promote R&D to expand the opportunity space for production activities and improve investment efficiency During 2010-2013, R&D accounted for 1.5 per cent of GDP, or less (Table 10). Promote STI for the development of the manufacturing and agricultural sectors. Step up investment in human capital. Step up support for youth empowerment through a system of apprenticeship, internship and entrepreneurship. Expand basic infrastructure and services to rural areas. Place emphasis on meritocracy in admission of students and job placement. Promote M&E. See full size image 38
See full size image 5. Strategies and Policies for Inclusive Growth in Nigeria Table 10: Nigeria: Share of R&D in GDP, 2010-2013 Share in GDP (%) Year GDP (N Billion) R & D (N Billion) 2010 55,469 821 1.5 2011 63,713 879 1.4 2012 72,600 905 1.2 2013 81,010 732 0.9 See full size image Source: NBS, Rebased GDP 39
See full size image 5. Strategies and Policies for Inclusive Growth in Nigeria Social Protection Programmes Overarching Goal (UNICEF/NPC/NISER, National Social Protection Policy, NSPP Report) To establish a gender-sensitive and age-appropriate framework to reduce exposure to risk, reduce poverty, enhance livelihood, contribute to inclusive development and promote a life of dignity. Specific Objectives: To reduce poverty among the people vulnerable to being poor To empower the poor vulnerable to economic shocks. To enhance human capital development To provide guiding principles of managing social protection projects and programmes See full size image 40
See full size image 5. Strategies and Policies for Inclusive Growth in Nigeria Social Protection Programmes Specific Objectives (Cont d): To promote social cohesion and inclusiveness To ensure citizens have access to basic services and infrastructure To provide social welfare and improve food security and nutrition To promote social equity and inclusive growth To ensure decent employment and sustainable livelihood To protect individuals and households from shocks that can make them fall into extreme poverty To promote synergy and coordination among all social protection intervention agencies. See full size image 41
See full size image 5. Strategies and Policies for Inclusive Growth in Nigeria Social Protection Programmes Levels of Social Protection Provision Protective (protecting households income and consumption, which includes social assistance programmes such as cash transfers, in-kind transfers, fee waivers to support access to basic and social services); Preventive (preventing households from falling into or further into poverty, including, for instance, health insurance programmes, subsidised risk pooling mechanisms); Promotive (promoting household s ability to engage in productive activities and increase incomes, for example through public works employment schemes, agricultural inputs transfers or subsidies); and Transformative (addressing social inequalities and discrimination, which includes, for example, core social protection programmes which tackle gender inequality and promote child rights and linkages to awareness-raising programmes or tackling discrimination). See full size image 42
See full size image 6. Financing Inclusive Growth Some Critical Issues Allocate responsibilities to stakeholders: the Federal Government, etc. (e.g. Table 11). Hold consultative forum involving major stakeholders on intervention strategies and policies for inclusive growth Finalize allocation of responsibilities to stakeholders Conduct needs assessment for each of the responsibilities, i.e. cost the various elements of the intervention strategies and policies. Aggregate cost and determine its distribution by stakeholder. See full size image 43
See full size image 6. Financing Inclusive Growth Table 11: Allocation of Responsibilities to Stakeholders Federal Government State Local Non-State Actors Development Partners Strategy/Policy Government Government Rise in Aggregate Investment Prioritize capital expenditure Provide basic infrastructure to support private investment Improve the regulatory framework for the financial and capital markets Cut cost of borrowing to single digit x x x - - x x x - - x - - - - See full size image x - - x - 44
See full size image 6. Financing Inclusive Growth Table 11 (Cont d): Allocation of Responsibilities to Stakeholders Federal Government State Local Non-State Actors Development Partners Strategy/Policy Government Government Programming of the structure and productivity of investment Promote R&D and STI Step up investment in human capital Step up youth empowerment Extend basic infrastructure to rural areas Place emphasis on meritocracy in admission of students and job placement Promote M&E Social Protection Programmes/polcies x x x x x x x x x x x x x x x x x x - x x x x - - See full size image x x x - - x x x x x 45
See full size image 6. Financing Inclusive Growth Government financing will typically take the form of budgetary allocation. Special funds such as the Sovereign Wealth Fund and public debt (internal and external) can complement budgetary allocation. Need for caution on borrowing. Private sector actors are expected to key into the proposed programmes under their corporate social responsibility portfolio. Development partners are expected to key into the proposed programmes as part of the country s development agenda. A number of programmes can be financed through PPP. See full size image 46
See full size image 7. Challenges and the Way Forward Conduct of needs assessment of intervention programmes [Need for research work] Policy and programme coordination among stakeholders [Stakeholders forum, M&E] Plan-budget link in Nigeria [Improved consultation between NPC and FMoF; NASS oversight function] Fiscal risks [Crude oil prices, Excess Crude Account, SWF, economic diversification] Institutional capacity to implement programmes [Training in budget implementation and procurement planning, etc.] Policy discontinuity [Development planning with features of inclusive growth, etc.] See full size image 47
See full size image 8. Conclusion and Recommendations The need for inclusive growth is global to address the prevalence of either poverty or income inequality or both. Inclusive growth has been embraced by a number of developing economies and development partners. Nigeria has recorded significant economic growth, particularly since return to civilian rule in 1999, but this has not resulted in poverty reduction, improvement in the distribution of income and significant reduction in the unemployment rate. Government at the Federal and subnational levels has responded to these challenges without much success. See full size image 48
See full size image 8. Conclusion and Recommendations The proposed strategies for achieving inclusive growth are: (i) Rise in aggregate investment; (ii) Programming of the structure and productivity of investment; and (iii) Social protection programmes. Financing of inclusive growth requires allocation of responsibilities to stakeholders and needs assessment for each of the responsibilities through a participatory process. Government financing of inclusive growth should typically take the form of budgetary allocation, but special funds such as the Sovereign Wealth Fund can complement it. See full size image 49
See full size image Thank You for Your Attention See full size image 50
