Explore model estimation techniques for analyzing proportions and ratios using svy.command in statistical analysis. Learn about average estimation, test scenarios, continuous variables, and actual vs. 4 times the sample size predictions for total land area.
Please find below an Image/Link to download the presentation.
The content on the website is provided AS IS for your information and personal use only. It may not be sold, licensed, or shared on other websites without obtaining consent from the author. If you encounter any issues during the download, it is possible that the publisher has removed the file from their server.
You are allowed to download the files provided on this website for personal or commercial use, subject to the condition that they are used lawfully. All files are the property of their respective owners.
The content on the website is provided AS IS for your information and personal use only. It may not be sold, licensed, or shared on other websites without obtaining consent from the author.
model estimation (4 times actual sample) Standard Errors 4 times the actual sample .8 S.E. of the prediction .6 .4 .2 0 0 5 10 15 Land, total (ha) Two-stage stratified SRS


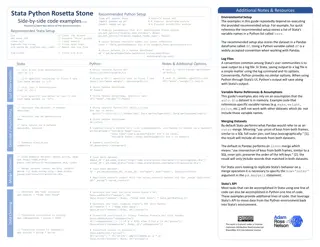
")


: svy command")
")
")
")