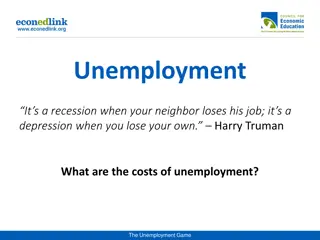
Monitoring Labor Market: Unemployment and Inflation
Measures of labor market activity, shortcomings of the unemployment rate, importance of monitoring inflation, impact of unemployment on production and income, and key statistics defining the labor force. Learn about the Current Population Survey and understand the significance of unemployment rates.

Download Presentation

Please find below an Image/Link to download the presentation.
The content on the website is provided AS IS for your information and personal use only. It may not be sold, licensed, or shared on other websites without obtaining consent from the author.If you encounter any issues during the download, it is possible that the publisher has removed the file from their server.
You are allowed to download the files provided on this website for personal or commercial use, subject to the condition that they are used lawfully. All files are the property of their respective owners.
The content on the website is provided AS IS for your information and personal use only. It may not be sold, licensed, or shared on other websites without obtaining consent from the author.
E N D
Presentation Transcript
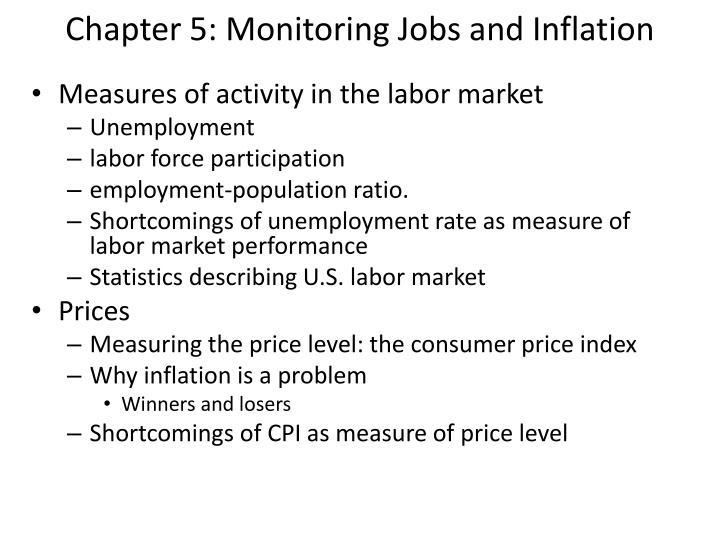
Chapter 5: Monitoring Jobs and Inflation Measures of activity in the labor market Unemployment labor force participation employment-population ratio. Shortcomings of unemployment rate as measure of labor market performance Statistics describing U.S. labor market Prices Measuring the price level: the consumer price index Why inflation is a problem Winners and losers Shortcomings of CPI as measure of price level
Unemployment Why is unemployment a problem? Lost production and income Lost human capital Measuring unemployment The Current Population Survey Monthly survey Approximately 60,000 households Used to monitor employment, hours, wages Primary source of data for unemployment rates
Labor Force Measures: December, 2011 U.S. population: 313.9 million Not in Civilian Non- Institutionalized Population Civilian Non-institutionalized Working age (16+) population: 244.4 m. 69.5. Out of labor force In Labor Force 155.5 m. 88.9 m. Employed Unemployed 143.3 12.2
Labor market definitions Civilian Non-institutionalized Working Age Population Excludes military and institutionalized Working age is 16+ Unemployed Without work but has made specific efforts to find a job within the previous four weeks Waiting to be called back to a job from which he or she has been laid off Waiting to start a new job within 30 days
Labor market statistics unemployed = unemployme nt rate civilian labor force civilian labor force = participat force labor ion rate civilian noninstitu tionalized working population age employed = employment - population ratio civilian noninstitu tionalized working population age
Using the data for December 2012, what is the unemployment rate? (Give your answer as a percentage rounded to nearest one-tenth e.g. 4.2 for 4.2 percent) 10
Employment ratio is more cyclical than labor force participation rate.
Unemployment as a measure of labor utilization. Imperfect measure because Excludes some underutilized Underemployed e.g. part-time workers who want full-time work Discouraged workers People who want jobs but quit searching due to lack of job opportunities Some unemployment is natural Even when economy is operating at capacity, there are new entrants who must search for jobs In 2008, more than 3 million new workers entered the labor force and more than 2.5 million workers retired in U.S. economy.
Sources of Unemployment People become unemployed if they 1. Lose their jobs and search for another job. 2. Leave their jobs and search for another job. 3. Enter or reenter the labor force to search for a job. People end a spell of unemployment if they 1. Are hired or recalled. 2. Withdraw from the labor force.
Types of Unemployment Frictional unemployment that arises from normal labor market turnover (entry, re-entry, etc.) Affected by UI generosity, demographics Structural unemployment created by changes in technology and foreign competition that change the skills needed to perform jobs or the locations of jobs Cyclical Fluctuating unemployment over the business cycle Temporary loss of jobs associated with a recession
Natural Rate of Unemployment The unemployment rate when the economy is at full employment has only frictional and structural unemployment, no cyclical unemployment Natural unemployment rate in 1980s was thought to be around 6%; thought to be around 5% in 1990s and 2000s.
Unemployment and Full Employment The natural unemployment rate changes over time and is influenced by many factors. Key factors are The age distribution of the population The scale of structural change Institutional rules Minimum wage Unions Labor laws Unemployment insurance
Real GDP and Unemployment Potential GDP is the quantity of real GDP produced when the economy is at full employment When the unemployment rate equals the natural rate Output Gap = Real GDP Potential GDP
Inflation Price level average of the prices that people pay for all the goods and services that they buy. Inflation rate percentage change in the price level between time periods. Inflation occurs when the price level is rising persistently. Deflation occurs when inflation is negative and prices are falling persistently
Why inflation is a problem Redistributes income and wealth Borrowers and lenders Employers and workers Taxes that are not indexed for inflation Diverts resources from production Inflation forecasting becomes more important Negotiate shorter contracts more frequently May lead to barter if inflation rises to sufficiently high levels (hyperinflation)
Measuring the price level and inflation Consumer Price Index (CPI) measures the average of the prices paid by urban consumers for a fixed basket of consumer goods and services. defined to equal 100 for the reference or base period. Using 1982-84 as the base year, the CPI in December 2009 was 216 prices in December 2009 were 116 percent higher than in 1982-84.
Constructing the CPI Selecting the basket Based on Consumer Expenditure Survey of 2001-02 Basket contains 80,000 goods
Constructing the CPI The monthly price survey Every month, BLS employees check the prices of 80,000 goods in 30 metropolitan areas Calculating the CPI 1. Find the cost of the CPI basket at base-period prices. 2. Find the cost of the CPI basket at current-period prices. 3. CPI in t = Cost of bundle at current prices in t X 100 Cost of bundle at base year prices
Base year = 2008 CPI in 2008 = (70/70)*100 =100 (CPI in base year always equals 100 CPI in 2009 = (70/50)*100 =140 Inflation rate between 2008 & 09 percentage change in CPI (140-100)/100 = 40%
Biases in CPI The CPI might overstate the true inflation for four reasons: New goods bias Quality change bias Commodity substitution bias Outlet substitution bias
Consequences of bias in CPI Increases government spending too quickly Social Security, Disability, etc. Approximately 1/3 of federal spending tied to CPI Causes tax revenue to rise too slowly Income tax code is tied to CPI Creates downward bias in estimate of real earnings growth Distorts private contracts tied to CPI Union COLA s
Other price indexes CPI for different types of consumers Urban consumers Urban workers Different regions, states, metro areas CPI for specific commodity groups Core CPI Excludes food and energy GDP deflator (covered earlier) Covers prices of all goods & services produced, not just what consumers purchase.
Adjusting for Inflation: Nominal vs. Real Variables Real Variable in t = Nominal Variable in t X 100 Price Index in t Price index could be CPI or GDP deflator e.g. If Nominal Wage in 2010 is $20 and CPI is 200, Real Wage in 2010 is ($20*100/200=$10) Real variable Adjusts nominal values to reflect prices in base year.