Monthly Nurse Safe Staffing Trends and Analysis Report
Explore the monthly trends in nurse safe staffing, turnover rates, vacancy rates, staff deployment, care hours per patient day, and safety and risk factors. Key insights are provided for each category to enhance staffing efficiency and patient care quality.

Uploaded on | 1 Views
Download Presentation

Please find below an Image/Link to download the presentation.
The content on the website is provided AS IS for your information and personal use only. It may not be sold, licensed, or shared on other websites without obtaining consent from the author. If you encounter any issues during the download, it is possible that the publisher has removed the file from their server.
You are allowed to download the files provided on this website for personal or commercial use, subject to the condition that they are used lawfully. All files are the property of their respective owners.
The content on the website is provided AS IS for your information and personal use only. It may not be sold, licensed, or shared on other websites without obtaining consent from the author.
E N D
Presentation Transcript
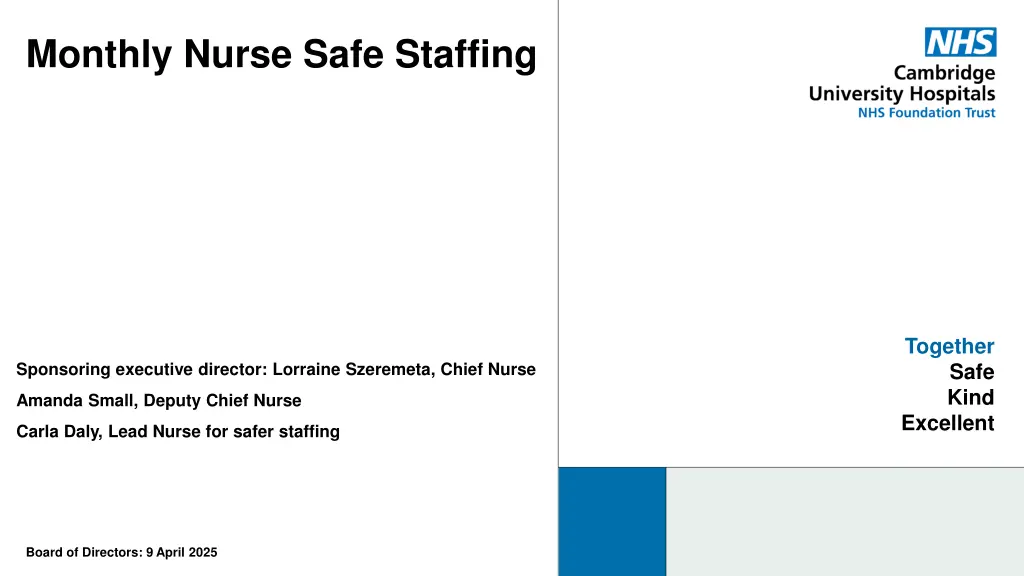
Monthly Nurse Safe Staffing Together Safe Kind Excellent Sponsoring executive director: Lorraine Szeremeta, Chief Nurse Amanda Small, Deputy Chief Nurse Carla Daly, Lead Nurse for safer staffing Board of Directors: 9 April 2025
Jan 2025 Dec 2024 Feb 2025 Target Trend Vacancy and turnover position Variance Commentary Slight increase in month from 5% in January however has been in a stable position since sept 2024. Turnover rate in month has decreased to 7.9% (8.4% January). Vacancy rate for Registered nurses (excl. midwife) (bands 5, 6, 7) 5% 5.3% 5% 5.4% Decreasing trend since September 2024. Turnover rate in month has decreased to 8.1% (8.8% in January). 5% 5.7% 5.1% 4.6% Vacancy rate for Registered midwives (bands 5, 6, 7) Slight increase in month from 14.9% in January . The trend overall is decreasing from 21.8% in September 2024. Turnover rate has reduced to 9.5% (9.8% in January). Vacancy rate for registered children s nurses (RCN) 5% 15.3% 14.9% 15.4% Decrease in vacancy rate in month from 24.3% in January. The turnover rate has increased to 27.3% from 24.4% in January. 5% 28% 24.3% 23.8% Vacancy rate for MSW (bands 2, 3, 4 in clinical services only) Decreasing trend continues from 10% in November. Turnover rate decreased to 12.8% from 13.8%. 5% 9.1% 8.2% 7.5% Vacancy rate for HCSW (excl MSW) (bands 2, 3, 4 in clinical services only) Jan 2025 Feb 2025 Planned verses actual staffing Target Dec 2024 Trend Variance Commentary This has been an improving trend over the last 12 months however in February there was a slight increase to 4 areas reporting overall fill rate <90% rota fill. 1 area reported <90% rota fill for registered RN/RM (2 in Jan) and 4 reported <90% rota fill for HCSWs (8 in Jan). Appendix 1. details the exception reports for Division E as the only division reporting overall fill rates of <90%. 0 3 3 4 Number of wards reporting <90% overall rota fill The overall fill rate has decreased to 91% from 93.8% in January however there has been a continued increase in the MSW fill rate to 80% (79% January). The lowest overall fill rates have been seen in Lady Mary Ward which have been mitigated through redeployment of staff where required to meet acuity needs. 90% 91% 93.8% 91% Midwifery and MSW fill rate Total unavailability of working time in January has increased slightly to 25.6% (25% January). The majority of unavailability (14.10%) was due to planned annual leave. Sickness absence had been an increasing trend over the last 6 months from 4.3% in August to 7.1% in December however has reduced to 6.6%. in February. 22% 26.1% 25% 25.6% Total unavailability of the Nursing and Midwifery workforce
Dec 2024 Jan 2025 Feb 2025 Staff deployment Trend Variance Commentary The number of substantive staff redeployed has reduced in month with an average of 240 hours redeployed per day (291 in December). This equates to 20 long day or night shifts per day (25 in December). It is expected that as sickness absence improves that the number of hours redeployed will continue to be a decreasing trend. Number of Substantive staff redeployed in month to support safe staffing (average hours redeployed per day) 291 270 240 Care hours per patient day (CHPPD) is the total number of hours worked on the roster (clinical staff including AHPs) divided by the bed state captured at 23.59 each day. CUH CHPPD recorded for Feburary has decreased slightly from 9.85 in January but is aligned with the Shelford group at 9.5 hours. In maternity, from 1 April 2021, the total number of patients now includes babies in addition to transitional care areas and mothers who are registered as a patient. CHPPD for the delivery unit in February has decreased slightly to 15.56 from 17.07 in January. 10.1 9.85 9.5 Care hours per patient day (CHPPD) Jan 2025 Dec 2024 Feb 2025 Safety and risk Trend Variance Commentary There has been a decreasing trend in the number of red flags reported over the last six months however this has increased slightly in February. The majority of the red flags reported has been in relation to an unmet 1:1 specialling requirement (35 occasions). There have been 20 red flags raised in relation to omission of planned mobilisation/obs or washes an increase from 16 in January. Unable to facilitate staff break has decreased to 2 from 8 in January. 80 72 85 Nurse staffing red flags reported There has been a decrese in the number of maternity red flags last month from 139 in Jan to 115 in Feb, in general there has been a reducing trend over the last 12 months. The highest reported red flag in February was a delay of >30 mins between presentation and triage (67 compared to 72 in January) and the second highest being missed or delayed care (48 compared to 38 in January). Significantly the delay of >6 hours in transfer to the delivery unit during IOL is 0% for February compared to 16% in January. 118 139 115 Maternity red flags reported There had been a decreasing trend in Safety Learning Reports (SLRs) completed in relation to nurse staffing during this financial year with 20 incidents reported in February compared to 33 incidents in January . The majority of these incidents were within Division E (8 incidents reported). Division A reported 2 incidents, Division B reported 5 incidents, Division C reported 1 incident and Division D reported 4 incidents. Staffing incidents reported 38 33 20
Appendix 1. Exception report by Division Division E exception report for <90% fill rate Unit Speciality % fill registered % fill care staff Overall filled % CHPPD Analysis of gaps Impact on Quality / outcomes Actions in place NQMs within variance, 0 HAPU 0 complaints incidents within variance Gaps mainly HCSW in week 2 and 3. This was due to redeployment to A5 for a 2:1 enhanced observations Daily review of mitigation within division for managing complex enhanced observations A3 400 - NEUROLOGY 92% 77% 87% 11.23 D Staffing reviewed to ensure safe care, Staff moved within service to provide safe staffing. Currently awaiting staffing review and Birth Rate Plus report. Lady Mary 501 - OBSTETRICS 95% 66% 83% 4.14 MSW vacancy reducing PIPELINE in continues E Low fill rate is attributed to the movement of staff within the division, staff sickness and vacancies of MSWs Staffing reviewed to ensure safe care, Staff moved within service to provide safe staffing. Regular assessment by manager of the day & matron to ensure service requirements are met. 560 - MIDWIFE LED CARE Rosie Birth Centre 90% 86% 89% 13.69 E Low fill rate due to reduced requirement to redeploy staff registered and non registered to meet demand in intrapartum areas. Staffing reviewed to ensure safe care, Staff moved within service to provide safe staffing. Regular assessment by manager of the day & matron to ensure service requirements are met. Sara Ward 501 - OBSTETRICS 89% 80% 87% 6.55 E Staffing compliance with critical care staffing guidance Adult critical care compliance with Guidelines for the provision of intensive care services (GPICS) Number of breaches of 1:1 care for level 3 patients 0 (0 in January) Number of breaches of side room co-ordinator 20 ( 10 in January) Neonatal critical care Number of breaches of British Association of Perinatal Medicine (BAPM) staffing standards 26.79% ( 32.26% in January) Number of occasions NICU closed due to staffing 0 ( in January) Paediatric critical care Number of breaches of Paediatric critical care society (PICS) staffing standards 0 ( 0 in January) Number of occasions PICU closed due to staffing 0 ( 0 in January)
SPC Icon Keys SPC key taken from Oxford University Hospitals Integrated Report