Monthly Temperature Variations Analysis in Eight Nigerian Stations
This study analyzes the monthly temperature variations in eight stations across Nigeria, discussing the factors influencing climate change and temperature profiles. Results show varied temperature trends based on tropical processes and regional influences.

Download Presentation

Please find below an Image/Link to download the presentation.
The content on the website is provided AS IS for your information and personal use only. It may not be sold, licensed, or shared on other websites without obtaining consent from the author.If you encounter any issues during the download, it is possible that the publisher has removed the file from their server.
You are allowed to download the files provided on this website for personal or commercial use, subject to the condition that they are used lawfully. All files are the property of their respective owners.
The content on the website is provided AS IS for your information and personal use only. It may not be sold, licensed, or shared on other websites without obtaining consent from the author.
E N D
Presentation Transcript
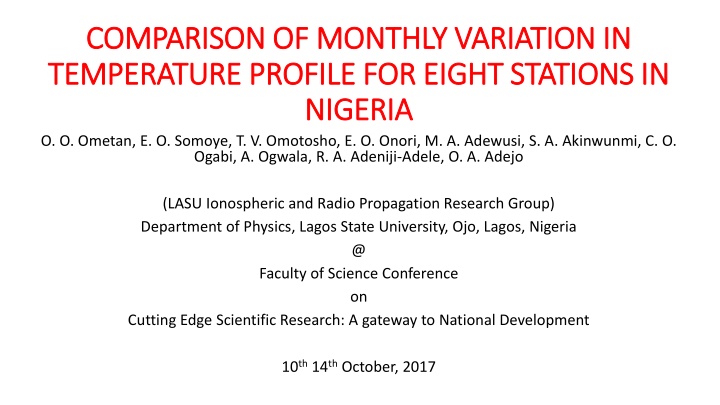
COMPARISON OF MONTHLY VARIATION IN COMPARISON OF MONTHLY VARIATION IN TEMPERATURE PROFILE FOR EIGHT STATIONS IN TEMPERATURE PROFILE FOR EIGHT STATIONS IN NIGERIA NIGERIA O. O. Ometan, E. O. Somoye, T. V. Omotosho, E. O. Onori, M. A. Adewusi, S. A. Akinwunmi, C. O. Ogabi, A. Ogwala, R. A. Adeniji-Adele, O. A. Adejo (LASU Ionospheric and Radio Propagation Research Group) Department of Physics, Lagos State University, Ojo, Lagos, Nigeria @ Faculty of Science Conference on Cutting Edge Scientific Research: A gateway to National Development 10th14thOctober, 2017
Outline Introduction Aim Materials and Methods Result and Discussion Conclusion References
Climate is what you expect, weather is what you get Heinlein, 1974.
Introduction One of the factors amongst others that causes climate change is temperature (Audu, 2012; Amadi et al., 2014). The heating of land and ocean as a result of radiative energy from temperature contrast that results from the different temperature responses in the tropics. the sun causes
Introduction The tropics is that part of the world where atmospheric processes differ decidedly and sufficiently from those in higher latitudes according to Riehl (1979). According to Audu et al., 2004, temperature increased by 0.34oC while the average minimum temperature increased between 1971 and 2010. by 3oC per decade
Introduction Ogolo Amobichukwu, 2013 observed a rise in surface temperature in Ibadan. Audu, 2012 also observed an increase in surface temperature over Lokoja and Katsina. Odjugo, 2010 observed a gradual increase of air temperature between 1901 and 1960, and a sharp increase from early 1970 till date. and Adeyemi, 2009, Egbinola and
Introduction What could possibly be the reason behind the variation in temperature profile? ITCZ North-east trade winds come from the Tropical Continental (cT) air mass South-west trade winds which come from the Tropical Maritime (mT) mass
Introduction Figure 1: Inter Tropical Convergent Zone across Africa
Introduction Figure 2: The maps of Africa showing the locations of the ITCZ in (a) in July (rainy season sets in) and (b) January (dry season sets in).
Aim The aim of this paper is to show the variation in temperature across five geopolitical zones in Nigeria using the data from 2003 to 2008 obtained at NIMET, Oshodi, Lagos, Nigeria.
Materials and Methods Secondary data were obtained from Nigerian Meteorological Agency (NIMET), Oshodi, Lagos, Nigeria. Statistical tools employed are: Histogram Arithmetic Mean Time series
Results and discussion Kano Jos Lokoja Ibadan 22 17.6 24.7 24.5 Average Annual Temperature Average Annual Temperature Average Annual Temperature Average Annual Temperature 17.4 21 24 24.5 17.2 20 23.5 17 24.3 19 16.8 23 16.6 18 24.1 22.5 16.4 17 16.2 22 23.9 16 16 21.5 2003 2004 2005 2006 2007 2008 2003 2004 2005 2006 2007 2008 23.7 21 Year Year 2003 2004 2005 2006 2007 2008 2003 2004 2005 2006 2007 2008 Year Year Figure 3: Variation in wet bulb temperature in Kano Figure 4: Variation in wet bulb temperature in Jos Figure 5: Variation in wet bulb temperature in Lokoja Figure 6: Variation in wet bulb temperature in Ibadan Calabar Enugu Ikeja Port-Harcourt 24.2 26 25.6 25.4 Average Annual Temperature Average Annual Temperature Average Annual Temperature Average Annual Temperature 25.3 25.4 24 25.5 25.2 25.2 25.1 23.8 25 25 25 24.5 23.6 24.9 24.8 24.8 24 23.4 24.7 24.6 24.6 23.5 23.2 24.4 24.5 23 24.4 23 24.2 2003 2004 2005 2006 2007 2008 2003 2004 2005 2006 2007 2008 2003 2004 2005 2006 2007 2008 2003 2004 2005 2006 2007 2008 Year Year Year Year Figure 7: Variation in wet bulb temperature in Ikeja Figure 8: Variation in wet bulb temperature in Calabar Figure 10: Variation in wet bulb temperature in Enugu Figure 9: Variation in wet bulb temperature in PH
Results and discussion 30 25 Average Minimum Temperature 20 2003 2004 15 2005 2006 2007 10 2008 5 0 Port Harcourt Calabar Enugu Ikeja Ibadan Lokoja Jos Kano Stations Figure 11: Yearly variation in the average minimum temperature (wet bulb) in all the stations
Results and discussion The mean minimum temperature obtained from each station were 25.1o C, 25.0o C, 23.7o C, 25.2o C, 23.4o C, 24.1o C, 17.2o C and 19.5o C for Port-Harcourt, Calabar, Enugu, Ikeja, Ibadan, Lokoja, Jos and Kano respectively. The maximum temperature (dry bulb) in all the stations was significantly higher than the minimum temperature (wet bulb).
Result and discussion The moisture content of air in the North is far less than in the South. This also show that the amount of water vapour will also be different. According to ITU-R, the temperature of moist air in the tropics is predicted to be 20o C.
Conclusion The variations in temperature is due to the shift in ITCZ position. This also account for the amount of rainfall expected in each station.
References [1] Amadi SO, Udo SO and Ewona IO (2014). Trends and Variations of monthly mean, minimum and maximum temperatures data over Nigeria for the period 1950-2012. International Journal of Pure and Applied Physics, 2(4):1- 27 [2] Egbinola C. N., Amobichukwu A. C., (2013) Climate Variation Assessment Based on Rainfall and Temperature in Ibadan, South-Western, Nigeria. Journal of Environment and Earth Science. 3(11), 32 [3] Ekpoh IJ (2011). Extreme climatic variability in North-western Nigeria: an analysis of rainfall trends and patterns. Journal of Geographical Geology, 3(1) :51- 62. [4] IPCC (2007). Climate Change 2007: The Physical Science Basis: IPCC Working Group I, Fourth assessment Report: Summary for Policy makers. [5] modelling, Recommendation. ITU-R P.837 4, Geneva, Switzerland International Telecommunication Union (2003), Characteristics of precipitation for propagation [6] Odekunle TO (2004). Rainfall and the length of growing season in Nigeria. International Journal of Climatology, 24: 467- 479. [7] [5] Odekunle TO (2010).An Assessment of the Influence of the Inter-Tropical Discontinuity on Inter-Annual Rainfall Characteristics in Nigeria. Journal of Geographical Research, 48(3): 314 326 [8] Odjugo P. A. O. (2010). General Overview of Climate Change Impacts in Nigeria. Journal of Human Ecology, 29(1): 47-55 [9] Riehl, H., 1979. Climate and weather in the tropics. Department of Atmospheric Science, Colorado State University, Fort Collins, Colorado, USA. 613. [10] Waliser D. E., Jiang X. (2014). Tropical Meteorology: Intertropical Convergence Zone. Encyclopedia of Atmospheric Sciences 2nd Edition.
Thank you for listening


![Read⚡ebook✔[PDF] Linking the Space Shuttle and Space Stations: Early Docking Te](/thumb/21519/read-ebook-pdf-linking-the-space-shuttle-and-space-stations-early-docking-te.jpg)