Mortality Rates and Catch Curves in Fisheries Population Dynamics
This content delves into the estimation of mortality rates in fish populations, discussing concepts like natural mortality, recruitment, fishing mortality, and migration. It explains how to calculate annual mortality rates, survival rates, and instantaneous mortality rates. Catch curves and population growth models are explored, providing insights into longitudinal and cross-sectional catch-at-age analyses. The material also presents example calculations and addresses the challenges of computing mortality rates from catch per unit effort (CPE) data.

Download Presentation

Please find below an Image/Link to download the presentation.
The content on the website is provided AS IS for your information and personal use only. It may not be sold, licensed, or shared on other websites without obtaining consent from the author. If you encounter any issues during the download, it is possible that the publisher has removed the file from their server.
You are allowed to download the files provided on this website for personal or commercial use, subject to the condition that they are used lawfully. All files are the property of their respective owners.
The content on the website is provided AS IS for your information and personal use only. It may not be sold, licensed, or shared on other websites without obtaining consent from the author.
E N D
Presentation Transcript
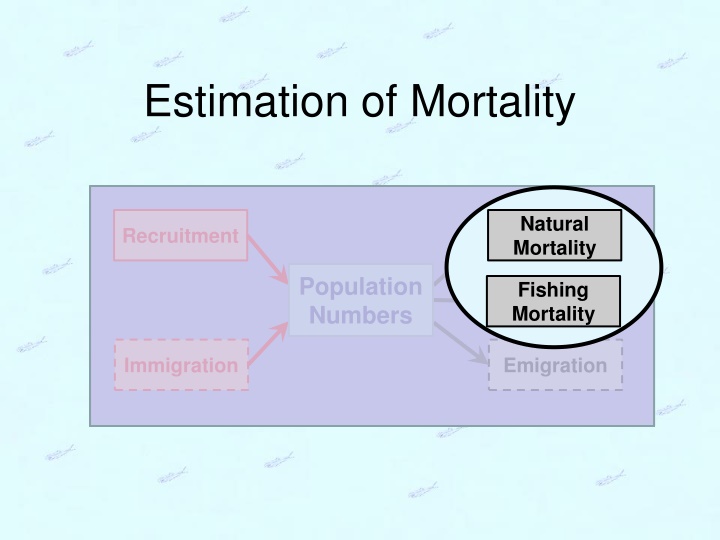
Estimation of Mortality Natural Mortality Recruitment Population Numbers Fishing Mortality Immigration Emigration
Recall Discrete Population Growth Model Nt+1 = (1+r)Nt where r = b-d+i-e Suppose that population is closed to migration following the same group of fish Thus, r = -d but d is usually replaced with A A is the annual mortality rate Solve for A 2 Catch Curves
Mortality Rate Concept For example, N1 = 1000 and N2 = 850. What is the mortality rate? What is the survival rate? S is an annual survival rate Note that A+S = 1 Such that S=1-A or A=1-S 3 Catch Curves
Instantaneous Mortality Rate (Z) Similarly examine continuous model r = -d but replace d with Z such that Nt+1 = Nte-Z solve for Z thus, Z is an instantaneous mortality rate Note that S=e-Z and A = 1-e-Z 4 Catch Curves
Two Problems Population sizes are not usually seen. Z can be computed from CPEs Recall that Ct = qftNt Algebraically show that Z=log(CPEt)-log(CPEt+1) Catches or CPEs are subject to variability Catches are samples; Z is, thus, a statistic. If a cohort is followed over time, individual estimates of Z can be made and averaged. 5 Catch Curves
Example Calculations Calculate Z from each time step of population sizes. idealistic catches. realistic catches. composite (average) of realistic catches. IDEAL REAL t Nt Ct Ct* 0 1000 200 211 1 800 160 159 2 640 128 126 3 512 102 104 4 410 82 81 5 328 66 64 6 Catch Curves
Catch Curve Longitudinal Catch-at-age for a single cohort of fish. Cross-sectional Catch-at-age in a single year (across many cohorts of fish). 7 Catch Curves
Longitudinal vs. Cross-Sectional Catch-at-age across several capture years. Capture Year Age 2009 2010 2011 2012 2013 2014 2015 2016 0 200 200 200 200 200 200 200 200 1 160 160 160 160 160 160 160 160 2 128 128 128 128 128 128 128 128 3 102 102 102 102 102 102 102 102 4 82 82 82 82 82 82 82 82 5 66 66 66 66 66 66 66 66 What is the cross-sectional catch-at-age for 2012? What is the longitudinal catch-at-age for the 2010 year-class? Longitudinal=cross-sectional if Z and N0 are constant across time and cohorts. 8 Catch Curves
Catch Curve Model Recall: CPEt = qNt and Nt = N0e-Zt Substitute second into first CPEt = qN0e-Zt 200 Can this be linearized? 160 CPE 120 What is estimate of Z? 80 0 1 2 3 4 5 Age / Time 9 Catch Curves
A General Problem Some fish are not fully recruited to the gear and are, thus, not well-represented in the sample. Fish of these ages should be excluded from the mortality calculation. IDEAL REAL . Ct* t Nt 0 1000 200 211 1 800 160 159 2 640 128 126 3 512 102 104 4 410 82 81 5 328 66 64 Ct Ct 77 111 126 104 81 64 10 Catch Curves
Catch Curve Characteristics 4.0 3.5 3.0 2.5 log(CPE) 2.0 -Z 1 1.5 1.0 -Z 1 0.5 Descending Asc Dome 0 2 4 6 8 10 Age / Time Fit regression of log(CPE) on age only for ages on descending limb. 11 Catch Curves


")


