Moving Enterprise Data to JavaFX Charts with Extensions
The transition from JFreeChart to JavaFX Charts, leveraging JavaOne 2015 session insights by Bruce Schubert. Discover the benefits of JavaFX Chart Extensions Library for porting charts with ease, including unique chart types like Logging Axis and ChartViewers. Dive into a case study on porting the Wildfire Management Tool to JavaFX, and learn to create Logarithmic scatter charts for depicting wildland fire behavior."

Download Presentation

Please find below an Image/Link to download the presentation.
The content on the website is provided AS IS for your information and personal use only. It may not be sold, licensed, or shared on other websites without obtaining consent from the author.If you encounter any issues during the download, it is possible that the publisher has removed the file from their server.
You are allowed to download the files provided on this website for personal or commercial use, subject to the condition that they are used lawfully. All files are the property of their respective owners.
The content on the website is provided AS IS for your information and personal use only. It may not be sold, licensed, or shared on other websites without obtaining consent from the author.
E N D
Presentation Transcript
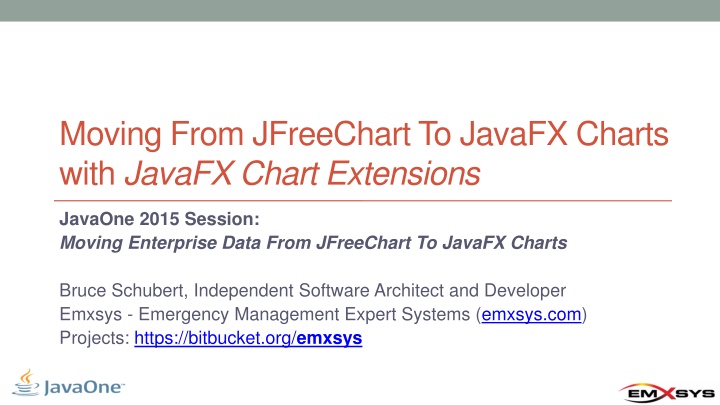
Moving From JFreeChart To JavaFX Charts with JavaFX Chart Extensions JavaOne 2015 Session: Moving Enterprise Data From JFreeChart To JavaFX Charts Bruce Schubert, Independent Software Architect and Developer Emxsys - Emergency Management Expert Systems (emxsys.com) Projects: https://bitbucket.org/emxsys
Enterprise Data Shared by the users of an organization; often plotted or graphed with JFreeChart JFreeChart JavaFX Charts De facto standard, rich, mature library Free, open source; pay for the Developer Guide Forum support by author Comprehensive collection of chart types Swing-based Cool, new, native JavaFX-based Missing many key features that are found in JFreeChart
Case Study: WildfireFX Application Port the Wildfire Management Tool (WMT) to JavaFX https://bitbucket.org/emxsys/wildfire-management-tool https://bitbucket.org/emxsys/wildfirefx
Objective: Use JFrees ChartViewer for Unique Chart Types ChartViewer included in the JFreeChart source distribution // Example: FXMLController snippet import org.jfree.chart.fx.ChartViewer; public class FXMLController implements Initializable { @FXML private AnchorPane pane; // A JFreeChart! private final SolarChart chart = new SolarChart("Solar"); @Override public void initialize(URL location, ResourceBundle resources) { pane.getChildren().add( } } new ChartViewer(chart));
Objective: Port the Haul Chart to JavaFX Logarithmic scatter chart depicting wildland fire behavior Logarithmic Axis Major Gridlines Subtitles Value Markers Annotations Text Lines Polygons Images
JavaFX Chart Extensions Library (Free!) Easier porting of JFreeChart charts to JavaFX Charts https://bitbucket.org/emxsys/javafx-chart-extensions
LogarithmicAxis Creates a Logarithmic XYChart LogarithmicAxis Pass to XYChart axis arguments MajorLogGridlines Add to XYChart subclass Call layoutGridlines() CSS: chart-major-vertical-grid-lines chart-major-horizontal-grid-lines final double MIN_X = 10d; final double MAX_X = 1000d; final double MIN_Y = 1d; final double MAX_Y = 100d; LogarithmicAxis xAxis = new LogarithmicAxis("Domain", MIN_X, MAX_X); LogarithmicAxis yAxis = new LogarithmicAxis("Range", MIN_Y, MAX_Y); LineChart chart = new LineChart(xAxis, yAxis, dataset);
Subtitle Extension Adds subtitle text to a chart Subtitle Add to Chart subclass Call layoutSubtitle() setSubtitle( ) CSS Style: chart-subtitle // Chart subclass snippet private Subtitle subtitle; public void setSubtitle(String text) { this.subtitle.setSubtitle(text); this.requestLayout(); }
Subtitle Implementation subtitleLabel is added to chart.getChildren() collection getChildren() returns {titleLabel,chartContent,legend} subtitleLabel added to children after titleLabel layoutSubtitle() modifies chartContent s size FYI: getChartChildren() returns chartContent titleLabel chartContent subtitleLabel yAxis plotArea xAxis legend plotBackground
XYMarker Extension ValueMarkers highlight values with a line and label XYMarkers Add to XYChart subclass Call layoutMarkers() ValueMarker Poscontrols label layout addDomainMarker() addRangeMarker() CSS Style: chart-marker-line chart-maker-label // XYChart subclass snippet private XYMarkers markers; public void addMinMaxMarkers(double maxX, double maxY){ markers.addDomainMarker(new ValueMarker( maxX, String.format("Max: %1$.1f", maxX),Pos.BOTTOM_RIGHT)); markers.addRangeMarker(new ValueMarker( maxY, String.format("Max: %1$.1f"", maxY),Pos.TOP_LEFT)); }
XMarkers Implementation Label placement controlled by Pos enum TOP_LEFT TOP_RIGHT Horizontal (range) marker labels Anchored to left/right of graph Placed above or below line Vertical (domain) marker labels Anchored to top/bottom of graph Placed left or right of line TOP_RIGHT TOP_LEFT BOTTOM_LEFT BOTTOM_RIGHT Tip: Create listeners on label s width and height properties to trigger text layout Label width and height are initially zero! BOTTOM_RIGHT BOTTOM_LEFT
XYTextAnnotation Draws a label on an XYChart XYAnnotations Add to XYChart subclass Call layoutAnnotations() XYTextAnnotation( ) Layer controls foreground/background Pos controls label layout add(XYTextAnnotation) CSS: chart-text-annotation // XYChart subclass snippet... private XYAnnotations annotations; public void addTextAnnotation(double x, double y, String text){ annotations.add(new XYTextAnnotation( text, x, y, Pos.TOP_LEFT), Layer.FOREGROUND); }
XYImageAnnotation Draws an image on an XYChart XYAnnotations Add to XYChart subclass Call layoutAnnotations() XYImageAnnotation( ) Layer controls foreground/background Pos controls image placement add(XYImageAnnotation) // XYChart subclass snippet... private XYAnnotations annotations; public void addImageAnnotation(double x, double y, String path) { Image image = new Image(getClass().getResourceAsStream(path)); annotations.add(new XYImageAnnotation( image, x, y, Pos.CENTER), Layer.FOREGROUND); }
XYLineAnnotation Draws a line on an XYChart XYAnnotations Add to XYChart subclass Call layoutAnnotations() XYLineAnnotation( ) Layer foreground/background Optional width and color add(XYLineAnnotation) CSS: chart-line-annotation // XYChart subclass snippet... private XYAnnotations annotations; public void addLineAnnotation(double x, double y, double x2, double y2) { annotations.add(new XYLineAnnotation( x1, y1, x2, y2, 2.0, Color.RED), Layer.FOREGROUND); }
XYPolygonAnnotation Draws a polygon on an XYChart XYAnnotations Add to XYChart subclass Call layoutAnnotations() XYPolygonAnnotation( ) Layer foreground/background Optional line width and fill colors add(XYPolygonAnnotation) CSS: chart-polygon-annotation // XYChart subclass snippet... private XYAnnotations annotations; public void addPolygonAnnotation(double[] xyPoints) { annotations.add(new XYPolygonAnnotation( xyPoints, 2.0, Color.BLACK, Color.DARKORANGE), Layer.BACKGROUND); }
XYAnnotations Implementation chart.getPlotChildren() returns plotArea Annotation layers are Group objects added to plotArea children Foreground: last entry in plot area Background: first entry in plot area foreground plotArea plotContent zero lines, gridlines, row fills zero lines, gridlines, row fills zero lines, gridlines, row fills zero lines, gridlines, row fills background
In Closing JavaFX Chart Extensions project: https://bitbucket.org/emxsys/javafx-chart-extensions WildfireFX project: https://bitbucket.org/emxsys/wildfirefx Wildfire Management Tool project: https://bitbucket.org/emxsys/wildfire-management-tool Twitter: @Emxsys Email: bruce@emxsys.com


")