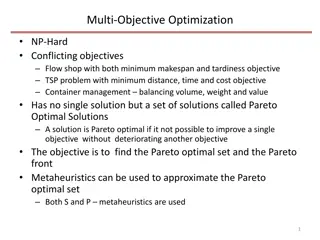
Multi-Objective Decision Modeling & Value-Focused Thinking

Learn about multi-objective decision modeling involving multiple stakeholders, using real cases and insights from experts like Ralph Keeney. Explore the practice of Value-Focused Thinking to make better decisions aligned with personal objectives. Discover tools, techniques, and applications for enhancing decision-making processes across various domains.

Download Presentation

Please find below an Image/Link to download the presentation.
The content on the website is provided AS IS for your information and personal use only. It may not be sold, licensed, or shared on other websites without obtaining consent from the author.If you encounter any issues during the download, it is possible that the publisher has removed the file from their server.
You are allowed to download the files provided on this website for personal or commercial use, subject to the condition that they are used lawfully. All files are the property of their respective owners.
The content on the website is provided AS IS for your information and personal use only. It may not be sold, licensed, or shared on other websites without obtaining consent from the author.
E N D
Presentation Transcript
TEACHING MULTI-OBJECTIVE MULTI-STAKEHOLDER DECISION MODELING WITH CASES L. Robin Keller*, Jay Simon** * University of California, Irvine, USA President, INFORMS (INFORMS.org) ** Defense Resources Management Institute, USA 11TH International Workshop on Operations Research OR & Human Welfare: Health, Environment, and Education Havana, Cuba, March 10-13, 2015 1
Decision Analyst Ralph Keeney advises us to practice Value-Focused Thinking Thinking about what we value as expressed in our objectives Front Cover Keeney, R. L. 1992. Value-Focused Thinking A Path to Creative Decision Making. Harvard University Press, Cambridge, MA. Hammond, J. S., R. L. Keeney, H. Raiffa. 1999. Smart Choices: A Practical Guide to Making Better Decisions. Harvard Business School Press. 2
Keeneys Personal Objectives Maximize my quality of life Enjoy life Be intellectually fulfilled Enhance the lives of family and friends Contribute to society Keeney (1992), Value Focused Thinking 3
MULTIPLE OBJECTIVE DECISIONS UNDER CERTAINTY Model Objectives hierarchies of stakeholder(s) Additive weight & rate multiple objective measurable value function Software Use Excel with sliders to input swing weights Show sensitivity analysis in real time as bar graphs change Experiential Learning Applicable to business, personal, social/charity projects Apply in class, on homework, and in term project Students able & willing to take away & use in future Much of this material is at http://faculty.sites.uci.edu/lrkeller/classes/. LR Keller, JSimon, Y Wang. "Multiple objective decision analysis involving multiple stakeholders," Ch. 7 in M. R. Oskoorouchi (ed.) Tutorials in Operations Research- Decision Technologies and Applications. INFORMS. (2009). [faculty.sites.uci.edu/lrkeller/files/2011/06/multiple-objective-decision-analysis-involving-multiple-stakeholders.pdf] 4
MERGER DECISION ANALYSIS OF POTENTIAL MERGER OF OPERATIONS RESEARCH SOCIETY OF AMERICA (ORSA) AND THE INSTITUTE OF MANAGEMENT SCIENCES (TIMS) L. Robin Keller and Craig W. Kirkwood, The Founding of INFORMS: A Decision Analysis Perspective , Operations Research. 47(1), Jan.-Feb. 1999, 16-28. [faculty.sites.uci.edu/lrkeller/files/2011/06/The-Founding-of-Informs-Decision-Analysis.pdf] Powerpoint: http://faculty.sites.uci.edu/lrkeller/classes/ 5
ORSA/TIMS COOPERATION ALTERNATIVES SEP: SEPARATION OF ORSA & TIMS SQ: STATUS QUO PARTNERSHIP SM: SEAMLESS MERGER M2: MERGE WITH ORSA/TIMS AS SUB-UNITS M3: MERGE WITH NO ORSA/TIMS SUB-UNITS; SUB-UNITS ARE REPRESENTED ON BOARD 6
ORSA/TIMS MERGER OBJECTIVES FIVE MAIN CATEGORIES IMPROVE COST EFFICIENCY ENHANCE QUALITY OF PRODUCTS ESTABLISH STRONG EXTERNAL IMAGE MAINTAIN SCOPE/DIVERSITY OF FIELD IMPROVE OPERATIONS Elicited stakeholders objectives & combined them into 1 hierarchy 7
ADD BRANCHES TO MAIN CATEGORIES IMPROVE COST EFFICIENCY MAINTAIN EFFICIENT REVENUES AND EFFICIENT USE OF FUNDS EXPENSES USE OF ALLOCATE WELL MAINTAIN TIME EXPLOIT BALANCE DUES REMOVE ECONOMIES RATE & FEE- DOUBLED OF SCALE FOR-SERVICEDUES 8
VALUE RATING SCALE 2: SEEN BY AVERAGE MEMBER AS IMPROVED 1: SEEN BY OFFICERS AS IMPROVED BUT NOT BY AVERAGE MEMBER 0: NO CHANGE -1: SEEN BY OFFICERS AS WORSE -2: SEEN BY AVERAGE MEMBER AS WORSE 9
INTERPRETATION OF MEASURABLE VALUE RATINGS STRENGTH OF PREFERENCES IS REFLECTED IN DIFFERENCES OF VALUES DEGREE OF IMPROVEMENT FROM 0 TO 1 IS THE SAME AS FROM 1 TO 2 10
JUDGED VALUE RATING SCORES JUDGED VALUE RATING ON ALTERNATIVES SEP SQ SM M2 M3 OBJECTIVES 1. IMPROVE COST EFFICIENCY 1.1 MAINTAIN EFFICIENT USE OF FUNDS -2 0 1 -1 1 1.1.1 EXPLOIT ECONOMIES OF SCALE -2 0 1 -1 1 1.1.2 BALANCE DUES RATE AND FEE-FOR-SERVICE -1 0 2 1 2 1.1.3 REMOVE DOUBLED DUES 11
WEIGHTS FOR OBJECTIVES SUM OF WEIGHTS IS 1OO% FOR ALL LOWEST LEVEL OBJECTIVES OBJECTIVE S WEIGHT DEPENDS ON RANGE ATTAINABLE ON OBJECTIVE Use a SWING WEIGHT Interpretation Assume a weighted Additive Model DECISION MAKER JUDGES WEIGHTS ON OBJECTIVES 12
Judged Evaluation Considerations Cooperation Alternative SEP SQ Weight SM M2 M3 1. Improve cost efficiency of TIMS/ORSA operations 1.1 Maintain efficient use of funds 1.2 Allocate well revenues/expenses to activities/entities 1.3 Maintain efficient use of time of volunteers 2. Enhance the quality of ORSA and TIMS products 2.1 Provide high quality main and specialty conferences 2.2 Provide high quality publications 2.3 Provide appropriate career services 2.4 Provide support for sub-units 2.5 Provide other member services 3. Establish a strong & coherent external image of field 3.1 Increase visibility and clout of OR and MS 3.2 Foster professional identity 4. Manage the scope and diversity of the field 4.1 Maintain/improve membership composition 4.2 Create strong relationships with other societies 5. Maintain/improve effectiveness of ORSA and TIMS operations 5.1 Maintain/improve quality of governance process 5.2 Maintain/improve quality of operation output 13
COMPUTE WEIGHTED AVERAGE OF VALUE RATINGS MULTIPLY OBJECTIVE S WEIGHT TIMES VALUE RATING ON EACH OBJECTIVE SUM UP OVER ALL OBJECTIVES (Use SUMPRODUCT function in Excel) RECOMMENDED OPTION IS ONE WITH HIGHEST OVERALL VALUE 14
Robin Keller's Evaluation, 12/21/93 Evaluation of ORSA/TIMS Cooperation Alternatives Judged Score on Cooperation Alternatives Evaluation Consideration Top Level Weights Weights Weights WeightsWeights SEP 0.050 0.015 0.005 0.005 0.005 0.005 0.030 0.720 0.240 0.170 0.050 0.020 0.240 0.020 0.010 0.040 0.030 0.040 0.080 0.020 0.080 0.020 0.020 0.020 0.010 0.010 0.105 0.005 0.005 0.010 0.040 0.040 0.005 0.055 0.020 0.005 0.005 0.010 0.010 0.005 2nd Level 3rd Level 4th Level Judged SQ SM M2 M3 1. Improve cost efficiency of TIMS/ORSA 1.1 Maintain efficient use of funds 1.1.1 Exploit economies of scale 1.1.2 Balance dues rate and fee-for-services 1.1.3 Remove doubled dues 1.2 Allocate well revenues/expenses 1.3 Maintain efficient use of time 2. Enhance quality of ORSA/TIMS products 2.1 Provide high quality conferences 2.1.1 Provide quality program 2.1.2 Manage balance between acad./prac. 2.1.3 Set fair cost to member 2.2 Provide high quality publications 2.2.1 Maintain successful editorial oversight 2.2.2 Maintain/increase circulation 2.2.3 Maintain reputation of journals 2.2.4 Improve readability of tech. journals 2.2.5 Provide outlet for applied papers 2.2.6 Provide forum for prof. comm. 2.2.7 Maintain fair subscription costs 2.3 Provide appropriate career services 2.3.1 Support degree/cont. education 2.3.2 Facilitate networking 2.3.3 Provide successful job placement 2.3.4 Increase job opportunities 2.3.5 Stimulate research/applications 2.4 Provide support for sub-units 2.4.1 Provide start-up financial support 2.4.2 Maintain loose/tight mgt. of sub-units 2.4.3 Provide business office support 2.4.4 Support sub-unit tracks in main confer. 2.4.5 Support sub-unit conferences/journals 2.4.6 Retain current/potential sub-units 2.5 Provide other member services 2.5.1 Take lead in use of info. Technology 2.5.2 Improve quality of trans. With offices 2.5.3 Outreach to affiliate with related prof. act. 2.5.4 Provide improved support for practitioners 2.5.5 Provide improved support for lone pract. 2.5.6 Provide improved support for academics 3. Establish a strong/coherent ext'l image of field 0.100 3.1 Increase visibility & clout of OR/MS 3.1.1 Clarify image of OR/MS and ORSA & TIMS 3.1.2 Make name & activities known to press 3.1.3 Support develop./retention of OR units 3.1.4 Improve liaison role 3.2 Foster professional identity 3.2.1 Closeness of job title match to name of org. 3.2.2 Maintain OR/MS & ORSA/TIMS name rec. 3.2.3 Make membership signal prof. Identity 4. Manage the scope and diversity of the field 4.1 Maintain appropriate member. comp. 4.1.1 Maintain/increase number of members 4.1.1.1 Retain current members 4.1.1.2 Attract young people to the field 4.1.1.4 Attract non-members to the field 4.1.2 Manage diversity of members 4.1.2.1 Foster International memberships 4.1.2.2 Strike balance bet. business/engineering 4.1.2.3 Support institutional members (Roundtable) 4.2 Create strong relations. w/ other soc. 5. Improve effectiveness of operations 5.1 Improve quality of govern. process 5.1.1 Streamline governance structure 5.1.2 Improve sub-units' representation 5.1.3 Speed up decision making process 5.2 Improve quality of operations 5.2.1 Focus collective resources on import.. act. 5.2.2 Decrease overlap in offices' responsibilities 5.2.3 Decrease overlap in activities, sub-units, etc. 0.005 0.005 0.005 0.005 0.030 -2.0 -2.0 -1.0 -1.0 -1.0 0.0 0.0 0.0 0.0 0.0 1.0 1.0 2.0 1.0 2.0 -1.0 -1.0 1.0 -1.0 -1.0 1.0 1.0 2.0 1.0 2.0 0.170 0.050 0.020 -2.0 -1.0 -1.0 0.0 0.0 0.0 0.0 0.0 0.0 -1.0 -1.0 -1.0 0.0 1.0 1.0 0.020 0.010 0.040 0.030 0.040 0.080 0.020 -1.0 -1.0 -1.0 0.0 0.0 -1.0 -1.0 0.0 0.0 0.0 0.0 0.0 0.0 0.0 0.0 1.0 0.0 0.0 0.0 0.0 1.0 0.0 0.0 0.0 0.0 0.0 0.0 0.0 1.0 1.0 0.0 0.0 1.0 1.0 1.0 0.020 0.020 0.020 0.010 0.010 -1.0 -2.0 -2.0 -1.0 -1.0 0.0 0.0 0.0 0.0 0.0 0.0 0.0 0.0 0.0 0.0 -1.0 -1.0 -1.0 0.0 -1.0 1.0 0.0 0.0 1.0 1.0 0.005 0.005 0.010 0.040 0.040 0.005 -1.0 -1.0 -1.0 -1.0 1.0 -1.0 0.0 0.0 0.0 0.0 0.0 0.0 1.0 0.5 0.5 0.0 0.0 0.0 -1.0 -1.0 -1.0 -1.0 -1.0 -1.0 1.0 1.0 1.0 1.0 2.0 1.0 0.020 0.005 0.005 0.010 0.010 0.005 -1.0 -1.0 -1.0 -0.5 -0.5 -0.5 0.0 0.0 0.0 0.0 0.0 0.0 0.5 0.5 0.0 0.0 0.0 0.0 -1.0 -1.0 -0.5 -0.5 -0.5 -0.5 1.0 1.0 2.0 0.5 0.5 0.5 0.080 0.010 0.020 0.040 0.010 0.010 0.020 0.040 0.010 -2.0 -2.0 -1.0 -1.0 0.0 0.0 0.0 0.0 1.0 1.0 0.5 0.5 -1.0 -1.0 0.0 0.0 2.0 2.0 1.0 2.0 0.020 0.001 0.010 0.009 0.001 0.010 0.009 0.0 -0.5 -0.5 0.0 0.0 0.0 0.0 0.0 0.0 0.0 0.0 0.0 -1.0 -0.5 0.5 0.050 0.045 0.020 0.010 0.005 0.005 0.010 0.005 0.005 -0.5 -0.5 -2.0 0.0 0.0 0.0 0.5 0.5 0.5 -0.5 -0.5 -0.5 1.0 1.0 1.0 0.025 0.010 0.005 0.010 0.010 0.005 0.010 0.005 -0.5 -1.0 -0.5 -1.0 0.0 0.0 0.0 0.0 0.0 0.0 0.0 0.0 0.0 0.0 0.0 0.0 0.0 1.0 0.0 1.0 0.005 0.080 0.020 0.010 0.005 0.005 0.010 0.005 0.005 -2.0 -2.0 1.0 0.0 0.0 0.0 2.0 0.0 2.0 -2.0 -2.0 -2.0 1.0 2.0 2.0 0.060 0.030 0.020 0.010 0.030 0.020 0.010 -2.0 -2.0 -2.0 0.0 0.0 0.0 2.0 1.5 2.0 -2.0 -2.0 -2.0 2.0 2.0 2.0 Total sum of judged weights, should = 1.00 1.000 1.000 1.000 -1.130 0.000 0.345 -0.695 0.856 SEP SQ Formula = SUMPRODUCT($F11:$F78,G11:G78) SM M2 M3 Calculated weighted average of overall value for each alternatives, based on judged weights OVERALL VALUE OF ALTERNATIVE 15
RESULTS OFFICERS PREFERRED MERGER3 ALTERNATIVE VOCAL OPPONENTS COMPROMISED ON SEAMLESS MERGER, AS LONG AS NEW NAME included OPERATIONS RESEARCH 16
OUTCOME MEMBERS VOTED TO MERGE IN SEAMLESS MERGER into INSTITUTE FOR OPERATIONS RESEARCH AND THE MANAGEMENT SCIENCES on JAN. 1ST, 1995 17
Perspectives of Multiple Stakeholders can help -identify mutually agreeable alternatives -foresee opposition to decisions -design new & better alternatives -understand the evolution of past decisions from multiple perspectives 18
Multiple-Stakeholder Decision Making The StarKist Tuna Fishing Decision Stakeholders San Diego, CA USA Tuna Fishing Fleet http://www.sandiegohistory.org/journal/81fall/images/piva.jpg http://www.earthisland.org/index.php/donate/ Monika I. Winn and L. Robin Keller, A Modeling Methodology for Multi-Objective Multi-Stakeholder Decisions: Implications for Research , Journal of Management Inquiry. 10(2), June 2001, 166-181. [faculty.sites.uci.edu/lrkeller/files/2011/06/A-Modeling-Methodology-for.-Multiobjective-Multistakeholder-Decisions.-Implications-for-Research.pdf] Much of this material is at http://faculty.sites.uci.edu/lrkeller/classes/ 19
Problem: Purse seine nets from boats can catch dolphins along with tuna fish image source http://www.crownprince.com/nets-tuna.htm 20
DECISION ALTERNATIVES Legal Quota Maintain current practices and stay within legal limits Limited Mortality Step up efforts to reduce the number of dolphins killed Zero-Mortality No fishing associated with setting nets on dolphins 21
Decision Alternatives Rated for Fishing Fleet TABLE 3. Decision Alternatives Rated for Fishing Fleet Objectives Hierarchy MAINTAIN VIABLE BUSINESS F1. Maintain Profitability F1.1. Maintain Lucrative Fishing Grounds F1.2. Maintain Lucrative Fishing Methods F1.3. Avoid Foreign Competition F2. Maintain Livelihood F2.1. Maintain Fishing Grounds in East. Tropical Pacific F2.2. Protect Large Investments in Boats F2.3. Prevent Fishing Grounds from Depletion F3. Maintain Quality of Life in Local Community F3.1. Protect Family-Owned Small Businesses & Heritage F3.2. Maintain Positive Image in Community F4. Protect Positive Image as Good Global Citizen F4.1. Legitimate Fishing Methods involving Dolphins F4.2. Publicize Successes in Reducing Dolphin Mortality Decision Alternatives Keep Status Quo Mortality + + + + + + ? + ? ? 0 Reduce Dolphin Go Dolphin Safe - - - - - - - - + - + + + ? ? + + + + + 0 + + favorable 0 neutral/balanced ? insufficient info. - unfavorable 22
Decision Alternatives Rated for Environmental Interest Groups TABLE 2. Decision Alternatives Rated for Environmental Interest Groups Decision Alternatives Keep Status Quo Mortality - - - - - + + ? + Reduce Dolphin Go Objectives Hierarchy Dolphin Safe + + + + + + + + + PROTECT MARINE MAMMALS E1. Stop Killing of Dolphins E1.1. Protect Intelligent Large Marine Mammals E1.2. Protect Species from Extinction E2. Stop Cruelty to Dolphins E2.1. Prevent Herding by Helicopter & Detonations E2.2. Prevent Harm from Entangling E3. Generate Positive Public Image for Cause E3.1. Maximize Favorable Media Coverage E3.2. Generate Positive Public Sentiment E4. Improve Prestige of Special Interest Group E4.1. Increase Financial Support E4.2. Gain Support from Celebrity Spokespersons ? - ? ? - + + ? ? 23
TABLE 5. StarKist's "Crisis Mode" StarKist s Crisis Mode Objectives Hierarchy Objectives Hierarchy Decision Alternatives Keep Status Quo Mortality - - + - + - - - - - - - - Reduce Dolphin Go Dolphin Safe + ? ? + ? + + + + + + + ? Objectives Hierarchy ENSURE FIRM SURVIVAL C1. Sustain Profitability C1.1. Maintain Favorable Industry Competitive Position C1.1.1 Maintain Viable Cost Structure C1.1.2 Maintain Revenue Stream C1.2. Ensure Technological and Operational Feasibility C2. Minimize Interference from Government Regulation C2.1. Minimize Regulation-Induced Cost Increases C2.2. Minimize Constraints on Managerial Discretion C3. Maintain Organizational Legitimacy C3.1. Maintain Image as "Good Corporate Citizen C3.1.1. Maximize Environmental Citizenship Image C3.1.2. Maximize Social Citizenship Image C3.2. Minimize Negative Perception at Critical Events C3.2.1. Minimize Negative Environmental Perception C3.2.2. Minimize Perception of Negative Social Impact ? + + ? + + ? ? ? ? - - ? StarKist s (1991) Dolphin Safe Policy "StarKist will not buy any tuna caught in association with dolphins in the Eastern Tropical Pacific." 24
Home Depot Case Sell Land? Feng, T., L. R. Keller, X. Zheng. 2008. Modeling Multi-Objective Multi-Stakeholder Decisions: A Case-Exercise Approach. INFORMS Transactions on Education 8(3) 103-114, (http://ite.pubs.informs.org/, http://pubsonline.informs.org/doi/abs/10.1287/ited.1080.0012 supplemental files: HomeDepotTeachingNote.pdf (for instructors), Excel file. Files also at http://faculty.sites.uci.edu/lrkeller/classes/ 25
The Home Depot Background Home Depot proposed to open a retail building supply store in San Juan Capistrano, California USA The new store would be on 15 acres in a strip of industrial land. Home Depot owned two acres of this land. The rest of the land was owned by the city, and would need to be bought. 26
The Home Depot Background The city would get $9 Million if it sells Home Depot the 13 acres. Many were concerned that a big box store would destroy its historical small town feeling. Nearby residents also worry that a Home Depot would cause traffic jams, pollute the air, produce noise and block ocean breezes. 27
Home Depot Case Alternatives Build Home Depot Don t develop the land Build a recreational vehicle park Build specialty retail facilities Stakeholders (assign 6 student groups) City of San Juan Capistrano Competing Local Small Businesses Complementary Local Small Businesses Home Depot Nearby Residents Other Area Residents 28
Case Instructions Ask the groups to: Brainstorm the objectives of the stakeholder. Create a hierarchy of objectives by grouping related objectives. Put the objectives in the spreadsheet. Rate the options performance on each objective on a scale from 0 to 10. Make their own judgment of the raw swing weights to put on the lowest level objectives. Answer questions and determine the best option based on the analysis. Post completed spreadsheet file to share. 29
Spreadsheet Structure for Each Stakeholder Questions for the City of San Juan Capistrano The City of San Juan Capistrano A.Brainstorm what the objectives of the City of San Juan Capistrano would be. To save time, finish ONLY the corresponding Excel spreadsheet for the city. Fill in the objectives on the spreadsheet. B.Rate the options performance on each objective on a scale from 0 to 10, with 10 best. C.Make your own judgment of the raw swing weights to put on the lowest level objectives. 10 9 8 7 6 D.You can use the slider to adjust the raw swing weights assigned to each lowest level objective. (Note: Do not use the slider until you fill out the corresponding lowest level objective in the same row.) 5 4 3 E.Calculate the overall value of each option. F.A bar graph based on the overall value of each option and a partial hierarchical tree of the objectives for the City of San Juan Capistrano will be created automatically on the bottom of the spreadsheet when your group completes all the steps above. G.Is there an option which is dominated (which is worse than one other dominating option on each objective)? H.Save the completed spreadsheet file under the name of CityofSanJuanCapistrano and post/email it to our course s discussion forum. Choose one person to report your results 2 1 0 Option 1 "Build Home Depot" Option 2 "Don't develop the land" Option 3 "Build RV Park" Option 4 "Build specialty retail" overall values A1.1 Promote job creation A1.2 Keep the city's retail base competitive Decision Alternatives Rated for the City of San Juan Capistrano orally to the class. A1.3 A1. Support the city and its residents A1.4 Rating on Each Objective 0 - 10 = best Option 1 "Build Home Depot" develop the A1.5 A1.6 Calculated Weights for Major Objectives Option 2 "Don't Option 3 "Build RV Park" Option 4 "Build specialty retail" Caculated Normalized Weights Fill in Raw Swing Weights (0- 100) Slider A2.1 Provide community service land" OVERALL OBJECTIVES A2.2 A2. Enhance viability of community A1.1 Promote job creation A1.2 Keep the city's retail base competitive A1.3 A1.4 A1.5 A1.6 A2.1 Provide community service A2.2 A2.3 A2.4 A2.5 A3.1 Minimize disruption to daily life A3.2 Minimize crime (day laborer congregation) A3.3 A3.4 A3.5 A3.6 A4.1 Minimize noise A4.2 Minimize hazardous material spills A4.3 A4.4 A4.5 A5.1 Minimize impact from possible earthquake A5.2 A5.3 A5.4 A5.5 OVERALL VALUE (SUMPRODUCT OF NORMALIZED WEIGHTS TIMES RATINGS) A2.3 A2.4 A1. Support the city and its residents A2.5 A3.1 Minimize disruption to daily life A3.2 Minimize crime (day laborer congregation) A2. Enhance viability of community Improve the City of San Juan Capistrano A3.3 A3. Optimize social impact on the city A3.4 A3.5 A3.6 A3. Optimize social impact on the city A4.1 Minimize noise A4.2 Minimize hazardous material spills A4. Minimize adverse environmental impact A4.3 A4. Minimize adverse environmental impact A4.4 A4.5 A5.1 Minimize impact from possible earthquake A5. Minimize health and safety impact A5.2 A5. Minimize health and safety impact A5.3 A5.4 A5.5 30
Identify groups objectives Rating on Each Objective 0 - 10 = best Option 1 "Build Home Depot" develop the Calculated Weights for Major Objectives Option 2 "Don't Option 3 "Build RV Park" Option 4 "Build specialty retail" Caculated Normalized Weights Fill in Raw Swing Weights (0- 100) Slider land" OVERALL OBJECTIVES A1.1 Promote job creation A1.2 Keep the city's retail base competitive A1.3 A1.4 A1.5 A1.6 Promote convenience of shopping A1. Support the city and its residents A1.1 Promote job creation A1.2 Keep the city's retail base competitive A1.3 Promote convenience of shopping A1. Support the city and its residents Improve the City of San Juan Capistrano A1.4 A1.5 A1.6 31
Complementary Local Small Businesses- Representative Hierarchy of Objectives Ratings on Each Objective 0 - 10 =best Option 1 "Build Home Depot" develop the Option 2 "Don't Option 3 "Build RV Park" Option 4 "Build specialty retail" Calculated Weights for Major Objectives Fill in Raw Swing Weights (0- 100) Caculated Normalized Weights Slider land" OVERALL OBJECTIVES 0.10 0.25 0.00 0.35 0.25 0.05 0.00 10 25 5 10 5 5 5 8 3 8 B1.1 Maintain prices competitive B1.2 Remain competitive by providing nearby convenience B1.3 B2.1 Minimize labor costs B2.2 Minimize Rent B2.3 Minimize Inventory Costs B2.4 OVERALL VALUE (SUMPRODUCT OF NORMALIZED WEIGHTS TIMES RATINGS) B1. Maintain market share 0.35 35 25 5 3 4 10 10 10 5 8 8 8 6 6 8 0.65 B2. Minimize costs 1.00 1.00 100 5.55 8.00 7.70 6.30 32
The Home Depot Home Depot in San Juan Capistrano? A Sample Spreadsheet to Evaluate the Home Depot Case Excel file (HomeDepotCase.xls) Make sure to choose "enable the macros" when you open the spreadsheet. If you still have the problem of adjusting the sliders due to the security level after that, please go to the menu of "tools->macro- >security", switch the security level from high to medium, save the file, then close the file and finally reopen the file and it should work. 33
Moving Sliders on Weights Dynamically Changes Graph Decision Alternatives Rated for the City of San Juan Capistrano Rating on Each Objective 0 - 10 = best Option 1 "Build Home Depot" develop the Calculated Weights for Major Objectives Option 2 "Don't Option 3 "Build RV Park" Option 4 "Build specialty retail" Caculated Normalized Weights Fill in Raw Swing Weights (0- 100) Slider land" OVERALL OBJECTIVES 0.10 0.10 0.10 0.00 0.00 0.00 0.10 0.02 0.10 0.05 0.00 0.06 0.09 0.05 0.00 0.00 0.00 0.05 0.07 0.07 0.00 0.00 0.01 0.01 0.01 0.00 0.00 100 100 100 10 10 10 0 0 0 2 0 0 5 5 5 A1.1 Promote job creation A1.2 Keep the city's retail base competitive A1.3 Promote conveniance of shopping A1.4 A1.5 A1.6 A2.1 Provide community service A2.2 Maintain small town feel A2.3 Increase tax revenue A2.4 Min. impact on local businesses A2.5 A3.1 Minimize disruption to daily life A3.2 Minimize crime (day laborer congregation) A3.3 Min. traffic A3.4 A3.5 A3.6 A4.1 Minimize noise A4.2 Minimize hazardous material spills A4.3 Min. air pollution A4.4 A4.5 A5.1 Minimize impact from possible earthquake A5.2 Min. traffic accidents A5.3 Min. impact on existing infrastructure A5.4 A5.5 OVERALL VALUE (SUMPRODUCT OF NORMALIZED WEIGHTS TIMES RATINGS) A1. Support the city and its residents 0.30 The City of San Juan Capistrano 100 20 100 50 4 0 10 0 0 10 0 10 7 0 5 10 4 10 7 5 A2. Enhance viability of community 10 0.27 9 8 63 90 51 0 0 0 10 10 10 8 3 8 1 8 8 7 A3. Optimize social impact on the city 6 0.20 5 4 51 75 66 0 0 0 10 10 10 8 8 5 8 8 5 3 A4. Minimize adverse environmental impact 2 0.19 1 0 15 15 15 0 0 0 10 10 10 5 5 5 5 0 0 Option 1 "Build Home Depot" Option 2 "Don't develop the land" Option 3 "Build RV Park" Option 4 "Build specialty retail" A5. Minimize health and safety impact 0.04 overall values 1.00 1.00 1011 4.35 5.05 4.59 5.59 34
Moving Sliders on Weights Dynamically Changes Graph Decision Alternatives Rated for the City of San Juan Capistrano Rating on Each Objective 0 - 10 = best Option 1 "Build Home Depot" develop the Calculated Weights for Major Objectives Option 2 "Don't Option 3 "Build RV Park" Option 4 "Build specialty retail" Caculated Normalized Weights Fill in Raw Swing Weights (0- 100) Slider land" OVERALL OBJECTIVES 0.11 0.12 0.03 0.00 0.00 0.00 0.02 0.02 0.10 0.06 0.00 0.08 0.11 0.06 0.00 0.00 0.00 0.06 0.09 0.08 0.00 0.00 0.02 0.02 0.02 0.00 0.00 91 100 25 10 10 10 0 0 0 2 0 0 5 5 5 A1.1 Promote job creation A1.2 Keep the city's retail base competitive A1.3 Promote conveniance of shopping A1.4 A1.5 A1.6 A2.1 Provide community service A2.2 Maintain small town feel A2.3 Increase tax revenue A2.4 Min. impact on local businesses A2.5 A3.1 Minimize disruption to daily life A3.2 Minimize crime (day laborer congregation) A3.3 Min. traffic A3.4 A3.5 A3.6 A4.1 Minimize noise A4.2 Minimize hazardous material spills A4.3 Min. air pollution A4.4 A4.5 A5.1 Minimize impact from possible earthquake A5.2 Min. traffic accidents A5.3 Min. impact on existing infrastructure A5.4 A5.5 OVERALL VALUE (SUMPRODUCT OF NORMALIZED WEIGHTS TIMES RATINGS) A1. Support the city and its residents 0.26 The City of San Juan Capistrano 20 20 84 50 4 0 10 0 0 10 0 10 7 0 5 10 4 10 7 5 10 A2. Enhance viability of community 0.21 9 8 63 90 51 0 0 0 10 10 10 8 3 8 1 8 8 7 6 A3. Optimize social impact on the city 0.25 5 4 51 75 66 0 0 0 10 10 10 8 8 5 8 8 5 3 A4. Minimize adverse environmental impact 2 0.23 1 0 15 15 15 0 0 0 10 10 10 5 5 5 5 0 0 Option 1 "Build Home Depot" Option 2 "Don't develop the land" Option 3 "Build RV Park" Option 4 "Build specialty retail" A5. Minimize health and safety impact 0.05 overall values 1.00 1.00 831 3.71 6.15 4.80 5.78 35
Case Discussion While comparing the results from different stakeholders, the instructor inputs the calculated overall values for each option from each group into a summary file to create bar charts showing results. Sample results from all the six stakeholders Take a class vote among the options to predict the actual vote. This approach can help decision makers understand the perspectives of different stakeholders, and provide a way to design more acceptable alternatives. 36
What do you think: Yes or No? Sell Land? (City voters voted on this issue in November 2002.) 37
Example Home Depot Case Perspectives Option 1 Build Home Depot Overall Values Option 2 Don't develop the land Option 3 Build RV Park Option 4 Build specialty retail 5.6 8.0 4.5 4.2 4.2 City of San Juan Capistrano Competing Local Small Businesses Complementary Local Small Businesses 0.6 3.0 5.0 10.0 9.4 5.0 5.7 3.5 1.0 5.2 1.0 1.0 Home Depot 1.0 6.2 1.4 4.2 Nearby Residents 3.8 0.8 3.6 Other Area Residents 38 Data from Executive Education session, February 2009. UC Irvine Merage
Each Alternative from Different Stakeholders Viewpoints Overall Values for Each Option 10 9 8 7 6 5 4 3 2 1 0 Option 1 "Build Home Depot" Option 2 "Don't develop the land" Option 3 "Build a RV Park" Option 4 "Build specialty retail" City of San Juan Capistrano Complementary Local Small Businesses Nearby Residents Competing Local Small Businesses Home Depot Other Area Residents 39
Each Stakeholders View of Different Alternatives Overall Values for Each Stakeholder 10 9 8 7 6 5 4 3 2 1 0 City of San Juan Capistrano Competing Local Small Businesses Complementary Local Small Businesses Home Depot Nearby Residents Other Area Residents Option 1 "Build Home Depot" Option 2 "Don't develop the land" Option 3 "Build a RV Park" Option 4 "Build specialty retail" 40
Appendix 1. Hospital capital budgets Don Kleinmuntz, former INFORMS President (now at Univ. of Notre Dame) (http://mendoza.nd.edu/research-and-faculty/directory/don-kleinmuntz/) started Strata Decision Technology (http://www.stratadecision.com/ ) to create Excel-based (or bigger database) software to aid hospital administrators in capital budgeting (choosing a set of expensive projects to fund), w/ an additive multiple attribute measurable value function + linear programming (Excel Solver or LINDO for knapsack problem) Their original capital budgeting software was StrataCap , new product is (cloud-based) Strata Jazz http://www.stratadecision.com/our-solutions/capital-and-equipment Video, in 1 out of 5 US hospitals: http://www.stratadecision.com/our-company/our-history 41
Maximize Project Benefits Weights on objectives (from Kleinmuntz) Financial Quality Strategy Maximize Cash Flows (NPV/IRR) Improve Patient Outcomes Increase Market Share 100 100 100 Identify most important objective(s) Score of 100 Rate others objectives relative to 100 90, 80, 50, Divide by total to get weights that add to 100% Enhance Patient/Family Satisfaction Enhance Information Integration 80 60 Enhance Physician Satisfaction Promote Operating Efficiency 75 65 Enhance Facility Quality 60 42
Hospital Capital Budgeting Objectives Hierarchy (from Kleinmuntz) Max. Project Benefits Financial Quality Improve patient outcomes Enhance patient/family satisfaction Enhance physician satisfaction Enhance facility quality Strategy Increase market share Enhance information integration Promote operating efficiency 65 Weights on objectives (from Kleinmuntz) 100 100 Identify most important objective(s) Score of 100 Rate others objectives relative to 100 90, 80, 50, Divide by total to get weights that add to 100% 80 65 60 100 60 43
Appendix 2. Planning for potassium iodide (KI) distribution for thyroid risk from radioactive iodine exposure Evaluate plans for distribution of potassium iodide (KI) to protect against thyroid cancer, when there will be radioactive iodine exposure as a result of an incident at a U.S. nuclear power plant. The types of KI distribution plans include the following: Predistribute to households, schools,hospitals, etc. Via mail Via voluntary pickup Stockpile at evacuation reception centers Do not predistribute T. Feng, L. R. Keller, A Multiple-Objective Decision Analysis for Terrorism Protection: Potassium Iodide Distribution in Nuclear Incidents , Decision Analysis, (June 2006), 3 (2): 76-93. http://pubsonline.informs.org/doi/abs/10.1287/deca.1060.0072 (supplement has Excel file) Much of this material is at http://faculty.sites.uci.edu/lrkeller/classes/ Based on book: http://www.nap.edu/catalog/10868/distribution-and-administration-of-potassium- iodide-in-the-event-of-a-nuclear-incident 44
KI study Objectives Minimize Radioactive Iodine Risk To Thyroid Maximize KI Availability Optimize Ability To Take KI On Time Minimize Harm From Inappropriate KI Administration Minimize Harm From Other Aspects Of Incident KI Procedures Don t Impede Evacuation Avert Mortality/Morbidity From Radiation Or Accidents Minimize Panic/Anxiety Due To KI Procedures KI Procedures Resource Use Not Excessive Simple KI Procedures Before/During Incident Educate Public To Respond To Incidents 45
Appendix 3. Biological Biological clock multi-objective utility model with weights on objectives changing over time (maximizing family life quality, social life quality, career life quality) CAREER WOMEN MIGHT WANT TO HAVE CHILDREN ASAP LiveScience, Nov. 9, 2007 -- A new mathematical model developed by professor Ralph Keeney and doctoral student Dinah Vernik of Duke's Fuqua School of Business could help women decide the optimal time in their lives to have kids http://www.livescience.com/health/071109-women-children.html Video of authors talking about paper: https://www.youtube.com/watch?v=mZxXf1W6FxM Analysis of the Biological Clock Decision , RL Keeney, D Vernik, http://dx.doi.org/10.1287/deca.1070.0094 2007 , 4(3), 114 - 135 (supplement has the Excel file and a user guide) 46
Appendix 4. Multi-objective Prostate Cancer Treatment Choice Jay Simon worked for a firm that had a prostate cancer decision analysis website to help potential patients make their treatment decision. Side effects reduce quality of life score multiplicatively Survival from prostate cancer without impotence or incontinence = 90 Survival from prostate cancer with incontinence = 90(80%) =72 Survival from prostate cancer with impotence = 90(60%) = 54 Survival from prostate cancer with impotence and incontinence = 90(80%)(60%) = 43.2 (new site, with more focus on info. : http://www.prostatesmart.info/) Decision Making with Prostate Cancer: A Multiple-Objective Model with Uncertainty , Jay Simon, 2009 39(3), 218 - 227, http://pubsonline.informs.org/doi/abs/10.1287/inte.1080.0406 47
Appendix 5. Andy Grove s Prostate Cancer In the fall of 1994, Andy Grove- the former CEO of Intel- was faced with a difficult problem to solve. Initially, he was presented with an abnormal screening PSA (Prostate Specific Antigen) test that could represent the presence of cancer. His first reaction was to ask what to do with that information. At this point, he may or may not have had cancer. So, to better define if there was a required decision, he chose to gather further information. Some basic facts he obtained gave him a first understanding of the probabilities and outcomes he might face, finding that 200,000 men were diagnosed with prostate cancer in 1994 and that 38,000 would be expected to die, making prostate cancer the second leading cause of cancer deaths in men. Since his PSA result was just over the upper limit of normal, he elected to repeat the test in early 1995 in case his results were within the error margin of the test. The results suggested more strongly the presence of a tumor and he visualized a sugar-cube-sized tumor in his prostate. These tests results convinced him of the need to see the urologist for a biopsy to define if the test result was a true positive or a false positive. 48
Andy Groves Prostate Cancer The biopsy results indicated his PSA result was a true positive. He did have prostate cancer. This led to the formulation of his decision problem. What type of treatment should Mr. Grove pursue for treatment of his prostate cancer? There appeared to be four main decision alternatives. One option was to have the tumor and prostate gland surgically removed. This alternative can increase the survival rate and decrease the recurrence rate as well, however it will lead to a greater chance of being impotent after the surgery. Another alternative was to receive radiation treatments in the form of seed implantation to destroy the cancer cells. This option can increase the survival rate, but it also has serious side effects. A third alternative was cryosurgery, or freezing the tumor cells. Regarding this option, there was not enough information available to make an informed decision. The last option was to do nothing, taking the wait and see approach, which also carried much risk of losing his life if the cancer grew very quickly. Apparently, none of these alternatives was perfect. Furthermore, several other stakeholders were also very concerned with Andy Grove s situation. Andy s dilemma will be modeled as a multi-stakeholder decision problem. Those stakeholders are: Andy Grove, Urologist, Oncologist, Andy s Family/Wife and Andy s Company Intel This case was written by L. Robin Keller and Tianjun Feng, of the UCI MSB, building upon the article by Andy Grove published in Fortune (1996), several case study reports by UCI HCEMBA students: L. Jeff Koh, Kenneth Rich, Suehei Lee, H. Ena Leo and others. See TAKING ON PROSTATE CANCER by Andy Grove with reporter associate Bethany McLean, FORTUNE, May 13, 1996. 49
Andy Groves Prostate Cancer Divide into 5 groups. For your stakeholder group, rate each alternative on each objective. Determine weights on objectives. Compute the overall weighted score for each alternative. Andy Grove Case Excel file at http://faculty.sites.uci.edu/lrkeller/classes/ 50


 distribution")