Multiple Linear Regression: Do's and Don'ts in Medical Statistics
Dive into the world of multiple linear regression with insights from Hans Burgerhof, as he covers some key dos and don'ts in this essential statistical method. Explore the underlying assumptions, building models, interaction terms, handling categorical variables, and more. Find out how to apply multiple linear regression effectively in your research.

Download Presentation

Please find below an Image/Link to download the presentation.
The content on the website is provided AS IS for your information and personal use only. It may not be sold, licensed, or shared on other websites without obtaining consent from the author.If you encounter any issues during the download, it is possible that the publisher has removed the file from their server.
You are allowed to download the files provided on this website for personal or commercial use, subject to the condition that they are used lawfully. All files are the property of their respective owners.
The content on the website is provided AS IS for your information and personal use only. It may not be sold, licensed, or shared on other websites without obtaining consent from the author.
E N D
Presentation Transcript
Multiple linear regression; some do s and don ts Hans Burgerhof Medical Statistics and Decision Making Department of Epidemiology UMCG
Help! Statistics! Lunchtime Lectures What? frequently used statistical methods and questions in a manageable timeframe for all researchers at the UMCG No knowledge of advanced statistics is required. When? Lectures take place every 2ndTuesday of the month, 12.00-13.00 hrs. Who? Unit for Medical Statistics and Decision Making When? Where? What? Who? Jun 13 2017 Sep 12 2017 Oct 10 2017 Nov 14 2017 Dec 12 2017 Room 16 Multiple Testing C. Zu Eulenburg H. Burgerhof D. Postmus S. La Bastide C. Zu Eulenburg 2 Slides can be downloaded from http://www.rug.nl/research/epidemiology/download-area
Todays Program - Introduction data and research question - Linear regression, what is it? - What are the underlying assumptions to make it a valid analysis? - Simple linear regression - Multiple linear regression - Interaction terms - Categorical explanatory variables - How to build a model?
The research question W. Heesen: Isolated Systolic Hypertension, PhD thesis written 1998 Cross sectional data on 1596 individuals in the North of the Netherlands, all older than 57 years For now: Which explanatory variables are related with the Systolic Blood Pressure, SBP? Can we predict (or explain) the SBP, using several explanatory variables?
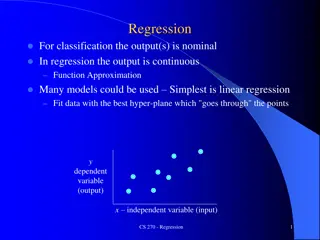
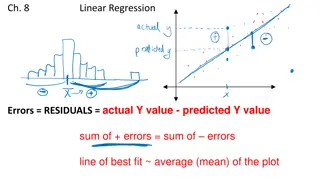
A simple linear regression model In mathematics, the equation of a line is given by: y = a x + b Y a 1 b 0 X In statistics, we prefer the formula: y = bo + b1 x b1 is the slope of the line b0 is the intercept (or constant)
Simple linear regression of SBP on Age (a continuous explanatory variable)
The best fitting line (according to least squares criterion) SBP = 110 + 0.75 Age
Formally We assume that in the population the relation between Y and X is: e (the error or residual) is a random variable from a normal distribution with unknown variance. This variance of e is independent from the value of X (homoscedasticity) = + + Y X e 0 1
The best fitting line (according to least squares criterion) SBP = 110 + 0.75 Age H0: 1 = 0
The explained part of the response variable Y (R2) Model Summary R R Square Adjusted R Square Std. Error of the Estimate Model 1 ,216a ,047 ,046 22,481 a. Predictors: (Constant), age in 1993 4.7% of the variation in Blood Pressures can be explained by the variation in Ages. The R2 gives you information about the fit of the model. The higher the R2, the better the fit.
Assumptions of linear regression The outcome variable Y is a continuous variable Independent observations Linear relation (instead of e.g. exponential) between Y and X The residuals come from a normal distribution The variability of the residuals is the same for each value of X (homoscedasticity)
In case of repeated measures (on the same individuals) These data should be analyzed using a more complex analysis
The linear regression table (SPSS) Coefficientsa Unstandardized Coefficients Standardized Coefficients Model 1 B Std. Error Beta t Sig. (Constant) 110,293 5,691 19,379 ,000 age in 1993 ,752 ,085 ,216 8,825 ,000 a. Dependent Variable: syst. blood pressure in 1993 Based on the P-value of the slope, we would conclude that there is a significant linear relationship between Age and SBP. Is it a valid conclusion, is it a valid test?
Check the assumptions Independent observations how have the data been collected? Linear relation (instead of e.g. exponential) between Y and X make a scatterplot (you started with it!) The residuals come from a normal distribution make a histogram or P-P plot of the residuals The variability of the residuals is the same for each value of X (homoscedasticity) make a scatter of residuals against predicted values
Simple linear regression of SBP on Sex (a binary explanatory variable) Men Women
Linear regression, is it of any use in this situation? ? DON T DO or
Regression on Sex Coefficientsa Unstandardized Coefficients B 159,257 Standardized Coefficients Beta Model 1 Std. Error t Sig. (Constant) ,857 185,882 ,000 sex 1,853 1,157 ,040 1,602 ,109 a. Dependent Variable: syst. blood pressure in 1993 Group Statistics t-test for independent groups: sex man N Mean 159,26 syst. blood pressure in 1993 721 woman 875 161,11 Independent Samples Test t-test for Equality of Means Sig. (2- tailed) Mean Difference Std. Error Difference t df syst. blood pressure in 1993 -1,602 1594 ,109 -1,853 1,157
So: Performing a simple linear regression with a binary explanatory variable is equivalent to performing a t-test for independent groups, assuming equal variances Why using a linear regression in this situation? If you want to correct (adjust) for the effect of other variables, you cannot do it in a t-test, but you can do it, using a multiple linear regression DO
Correcting for Age Mean Age of men: 65.9 years, Mean Age of women: 67.0 years There is a significant positive relationship between Age and SBP. Women have higher SBP (on average) than men Can the higher SBP for women be (partly) explained by the difference in Age?
A multiple linear regression Coefficientsa Standardized Coefficients Unstandardized Coefficients Model 1 B 110,146 Std. Error Beta t Sig. (Constant) 5,694 19,344 ,000 sex 1,047 1,135 ,023 ,922 ,356 age in 1993 ,746 ,086 ,214 8,720 ,000 a. Dependent Variable: syst. blood pressure in 1993 Sex is still not a significant predictor for SBP, but the difference between the mean SBP s is smaller than in the unadjusted analysis SBP = 110.15 + 1.05 Sex + 0.746 Age
In a graph Two lines for the price of one!
Should we always correct for other variables? Sex SBP Age In this graph, a causal pathway called DAG (Directed Acyclic Graph), Age is a mediator of the effect of Sex on SBP. If you are interested in the total effect of Sex on SBP, do not include Age in the model. If you are interested in the direct effect of Sex on SBP only, correct for Age. In experimental studies, you can correct for Age by design
Effect modification What if we think that the effect of Age on SBP might be different for males compared to females? Also called interaction , synergy , moderation ,
In a linear regression model, we have to introduce an interaction term Generally the product of the main effects: intAgeSex = Age Sex ??? = ?0+ ?1 ??? + ?2 ??? + ?3 ????????? Males (coded 0): SBP = 0 + 2 Age Females (coded 1): SBP = 0 + 1 + 2 Age + 3 Age = = ( 0 + 1) + ( 2+ 3) Age
Linear regression of SBP on Smoking (a categorical explanatory variable > 2 categories) No period One period Both periods SBP = b0 + b1 SmokingHistory ? ? DON T DO or
For a categorical explanatory variable: use dummy variables! Categorical Variable (Smoking) Dummy1 Dummy2 No period One period Both periods 0 1 0 0 0 1 SBP = b0 + b1 Dummy1 + b2 Dummy2 Use the R2 change test to test the effect of the categorical variable. Do not delete non-significant dummies without a good reason!
How to build a (linear) model? Select variables based on theory and/or univariate analyses (on a liberal alpha) Make a multivariate model including all possibly relevant variables Eliminate backward step-by-step non- significant variables ( = 0.05) Only test for interactions based on theory or clear patterns in your data Give the R2 of the final model
A linear model? ? = ?0+ ?1 ? + ?2 ?2 This is still a linear model; it is linear in its parameters!
Take home message Take to work message (regarding linear regression analyses) DO DON T - Start with graphs (for continuous X) - Check the assumptions - Test for relevant interactions - Select variables on a liberal alpha - Give R2 in your article - Include all variables, just because you measured them If you torture your data long enough - Use arbitrary codes for categorical data (with more than two categories)


")


 model?")