Municipal Water Resources Management with System Dynamics Approach
Explore how a system dynamics approach is utilized in municipal water resources management, incorporating water quality and energy consumption. This research delves into the complexities of water supply-demand dynamics, energy consumption, water quality implications, and scenario evaluations for sustainable water management practices.
Download Presentation

Please find below an Image/Link to download the presentation.
The content on the website is provided AS IS for your information and personal use only. It may not be sold, licensed, or shared on other websites without obtaining consent from the author. If you encounter any issues during the download, it is possible that the publisher has removed the file from their server.
You are allowed to download the files provided on this website for personal or commercial use, subject to the condition that they are used lawfully. All files are the property of their respective owners.
The content on the website is provided AS IS for your information and personal use only. It may not be sold, licensed, or shared on other websites without obtaining consent from the author.
E N D
Presentation Transcript
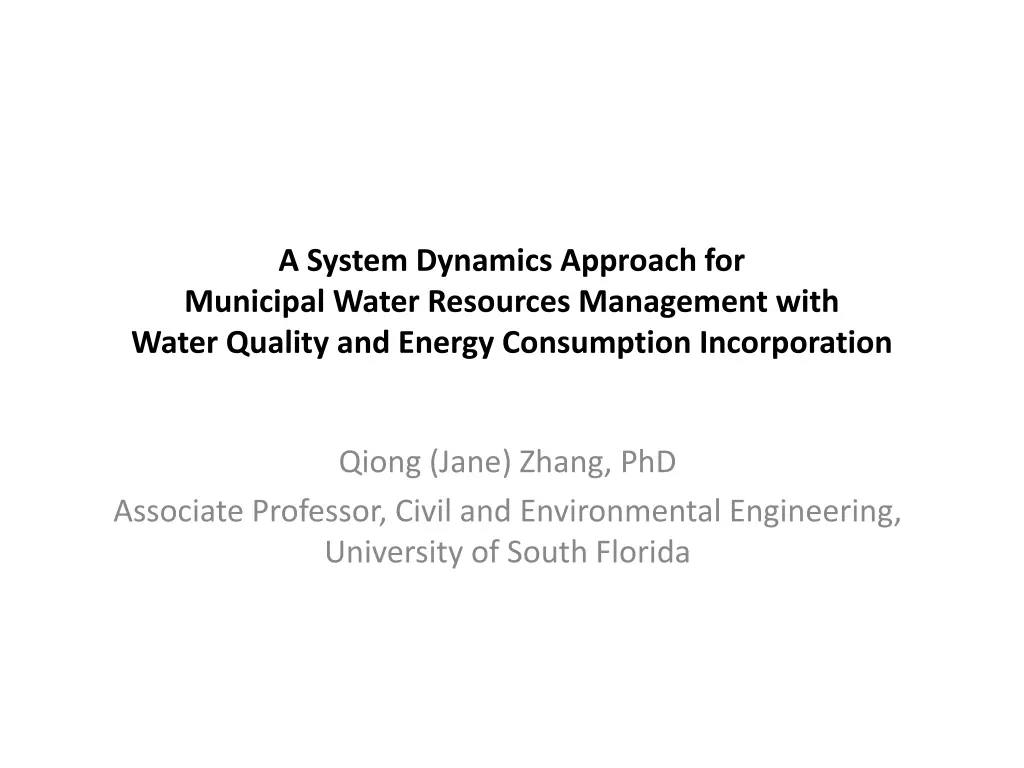
A System Dynamics Approach for Municipal Water Resources Management with Water Quality and Energy Consumption Incorporation Qiong (Jane) Zhang, PhD Associate Professor, Civil and Environmental Engineering, University of South Florida
Why System Approach? Traditional Thinking System Thinking Linear With feedback Overlook other impacts Holistic consideration Goal Goal Decision Decision Side Side Effects Effects Goal Goal Problem Problem VS VS Environment Environment Decision Decision Goals of Goals of Other Agents Other Agents Actions of Actions of Others Others Results Results
Our Model 65 Water System Dynamics Models Water Supply Problem Articulation Alternative Water Supply Model Formulation Scenario Evaluation Model Testing Research Gaps Demand in Energy Sector Water Quality Water Energy Consumption associated with Water Supply Supply-Demand Interaction Energy Consumption Formal Model Validation Water Quality
Spatial Boundary Temporal Boundary 1980 Model Testing 2010 Pasco County Scenario Evaluation Pinellas County Hillsborough County 2080 4
Causal-loop Diagram of Water Demand Indoor Water Use Efficiency - Indoor Water Demand per Capita Municipal Water Demand + Indoor Water Use - Budget on Rebates of Indoor Water Use Efficient Appliances + + + + Indoor Water Demand Population Change Rate + Municipal Water Supply (Potable Water) Indoor Water Conservation + + - Outdoor Water Demand Untreated Wastewater + + + + + + + Water Rates Budget on Water Conservation Eduction Population Outdoor Water Use + Outdoor Water Demand per Capita + + + Outdoor Water Conservation - - Treated Wastewater Reclaimed Water Supply - + + + Runoff Outdoor Water Use Efficiency Maximum Weekly Times of Irrigation + Budget on Reclaimed Water Supply - + + Budget on Rebates of Outdoor Water Use Efficient Appliances Discharge Wastewater Surface Water Storage Surface Water Level +
Causal-loop Diagram of Water Supply <Groundwater Withdrawals for Other Uses> + + Surface Water Withdrawals for Other Uses Surface Water Return Flow from Other Uses Budget on Reclaimed Water Supply Evaporation Surface Water Inflow Wastewater Discharge + + Treated Wastewater + - - + - + + Surface Water Outflow Surface Water Storage Untreated Wastewater - Surface Water Withdrawals for Municipal Uses Runoff + + + + + + Freshwater Withdrawals + + + + Precipitation Reclaimed Water Supply Municipal Water Use (Indoors and Outdoors) Fraction of Surface Water Withdrawals Outdoor Water Use + + - - + + Estimated Freshwater Withdrawals - Infiltration Fraction of Groundwater Withdrawals + + Groundwater Inflow + Water Loss Municipal Water Supply (Potable Water) + - + + Municipal Water Demand + Groundwater Outflow - Groundwater Storage + + - + Groundwater Withdrawals for Municipal Uses - - Groundwater Withdrawals for Other Uses Budget on Water Loss Control Groundwater Recharge - Intruded Seawater
Model Testing Average Inequality Statistics RMSE1 Variable Surface Water Level (Feet)? 26? UM US UC Observed Simulated 24? Surface Water Level (Feet) (Feet) Surface Water Level 21.6 21.6 21.7 21.7 0.2% 0.2% 0.02 0.02 0.47 0.47 0.28 0.28 22? 20? Municipal Water Withdrawal (MDG) 135.0 132.7 1.4% 0.02 0.00 0.53 18? Agricultural Water Withdrawal (MGD) 16? 79.0 1985? 82.7 5.3% 0.04 0.21 2005? 0.40 1980? 1990? 1995? 2000? Observation? Simulation? Energy Supply (Trillion Btu/Year) 39.9 31.8 4.1% 0.88 0.10 0.01 1Root mean square error 7
Model Testing Average Inequality Statistics RMSE1 Variable UM US UC Observed Simulated Surface Water Level (Feet) 21.6 21.7 0.2% 0.02 0.47 0.28 Municipal Water Withdrawal (MDG) 135.0 132.7 1.4% 0.02 0.00 0.53 Agricultural Water Withdrawal (MGD) 79.0 82.7 5.3% 0.04 0.21 0.40 Energy Supply (Trillion Btu/Year) 39.9 31.8 4.1% 0.88 0.10 0.01 1Root mean square error 8
Features of Current Model Incorporate alternative water supplies Consider sectoral water demand including water demand in energy sector Incorporate water quality and energy consumption associated with different water supply options Can investigate different demand and supply options Facilitate stakeholder engagement via graphical output and user interaction
Model Improvement in CNH Proposal Employing a more accurate representation of precipitation Considering water allocation between different users under shortages Investigating the water use and supply under climate change Test the hypotheses regarding water source switching through scenario analysis


