Na+ Homeostasis and Salt Stress Response in Grafted Tomato Plants
This study investigates Na+ homeostasis and salt stress response in grafted tomato plants focusing on the expression of SlCBL10 gene, Na+ and K+ contents, Na+/K+ ratio, and fruit yield under salt stress conditions. Various graft combinations were compared to explore the impact of rootstock on plant performance in response to salt treatment. The findings highlight the importance of SlCBL10 gene regulation in improving fruit production under salt stress.

Download Presentation

Please find below an Image/Link to download the presentation.
The content on the website is provided AS IS for your information and personal use only. It may not be sold, licensed, or shared on other websites without obtaining consent from the author.If you encounter any issues during the download, it is possible that the publisher has removed the file from their server.
You are allowed to download the files provided on this website for personal or commercial use, subject to the condition that they are used lawfully. All files are the property of their respective owners.
The content on the website is provided AS IS for your information and personal use only. It may not be sold, licensed, or shared on other websites without obtaining consent from the author.
E N D
Presentation Transcript
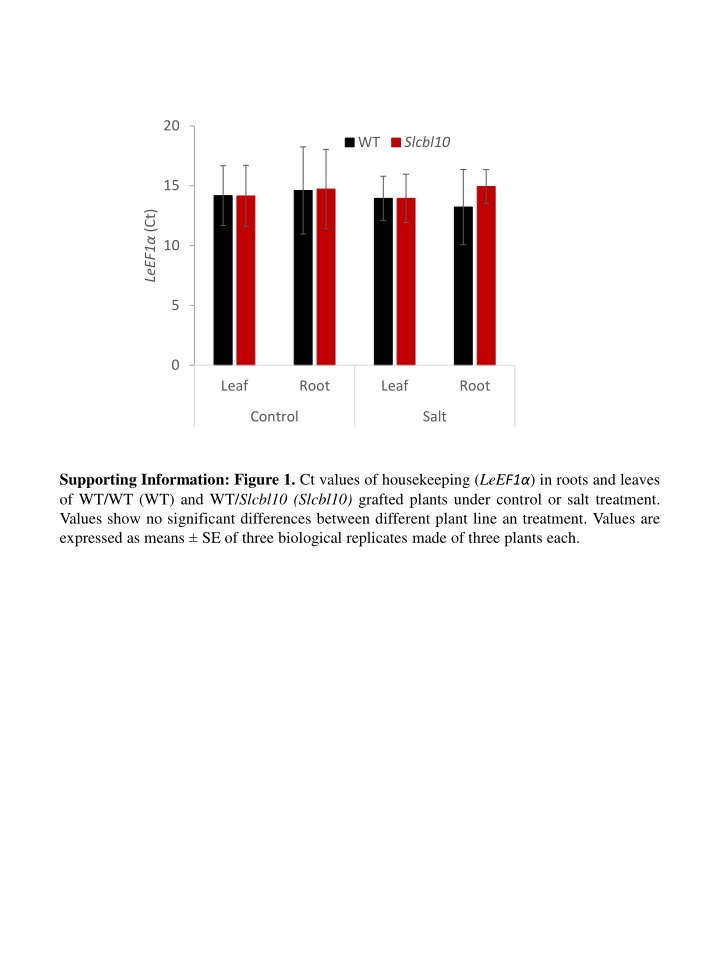
20 WT Slcbl10 15 LeEF1 (Ct) 10 5 0 Leaf Root Leaf Root Control Salt Supporting Information: Figure 1. Ct values of housekeeping (LeEF1 ) in roots and leaves of WT/WT (WT) and WT/Slcbl10 (Slcbl10) grafted plants under control or salt treatment. Values show no significant differences between different plant line an treatment. Values are expressed as means SE of three biological replicates made of three plants each.
Leaf Root 75 75 WT/WT WT/Slcbl10 Slcbl10/WT Slcbl10/Slcbl10 Na+(mmol Kg-1DW) Na+(mmol Kg-1DW) 50 50 25 25 0 0 Hoja 2,000 2,000 K+(mmol Kg-1 DW) K+(mmol Kg-1 DW) 1,500 1,500 1,000 1,000 500 500 0 0 Hoja 0.05 0.05 0.05 0.05 Na+/K+ ratio Na+/K+ ratio Na+/K+ ratio 0.04 0.04 0.04 0.04 0.03 0.03 0.03 0.03 0.02 0.02 0.02 0.02 0.01 0.01 0.01 0.01 0.00 0.00 0.00 0.00 Hoja Supporting Information: Figure 2. Na+, K+contents, and Na+/K+ratio, in roots and leaves of different graft combinations plants, self-grafted WT and Slcbl10 plants (WT/WT and Slcbl10/Slcbl10) and reciprocal grafted plants (WT/Slcbl10 and Slcbl10/WT), grown without salt (control). Values are expressed as means SE of three biological replicates made of three plants each.
2.5 2.5 a 2.5 2.5 2.0 2.0 2.0 2.0 SlCBL10 WT 1.5 1.5 1.5 1.5 b Slcbl10 1.0 1.0 1.0 1.0 c c RNAi 0.5 0.5 0.5 0.5 d d 0.0 0.0 0.0 0.0 0 DTS 2 DTS Supporting Information: Figure 3. Relative expression of SlCBL10 gene in roots of WT, Slcbl10 mutant and RNAi line. Values are means SE of three biological replicates made of three plants each. Expression level is referenced to expression level detected in WT root. Different letters indicate statistically significant differences according to Tukey s test (p < 0.05).
A WT WT WT Slcbl10 WT RNAi B Fruit yield (g/plant) Fruit number/plant Fruit weight (g) WT/WT WT/Slcbl10 WT/RNAi 6.9 0.5 b 12.7 2.5 a 12.4 1.1 a 2.52 0.3 a 1.99 0.1 a 2.43 0.2 a 2.75 0.1 b 6.40 0.2 a 5.11 0.1 a Supporting Information: Figure 4. Downregulation of SlCBL10 gene in rootstock increase fruit production in salt stress growth conditions. (A) Representative pictures of fruits from different graft combinations after 15 days of salt treatment (DST) at 150 mM NaCl. (B) Fruit yield, fruit number per plant and fruit weight average of different grafting combinations measured after 15 DST. Values are expressed as means SE of three biological replicates made of three plants each. Different letters indicate statistically significant differences among means according to Tukey s test (p < 0.05).
10 WT/WT a 8 WT/Slcbl10 WT/Slcbl10 a 6 SlCBL10 4 b b 2 0 Control Salt 6 a 3 a a 4 SlHKT1;2 SlSOS1 2 b b b b 2 b 1 0 0 Control Salt Control Salt 20 10 8 15 a LeNHX3 LeNHX4 6 a 10 a 4 ab b 5 b b 2 b 0 0 Control Salt Control Salt Supporting Information: Figure 5. Changes induced in SlCBL10 gene expression and genes involved in Na+homeostasis in leaves (WT scion) of self-grafted WT plants and WT grafted onto Slcbl10 mutant at 0 (Control) and after 2 days of 150 mM NaCl (Salt). For each gene, values are mean of three biological replicates made of three plants each. Expression levels are referred to expression level detected in WT root. Different letters indicate statistically significant differences among mean values according to Tukey s test (p < 0.05).
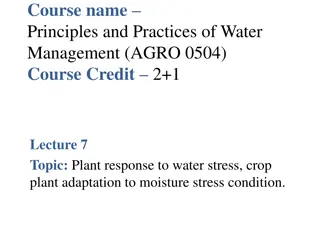
Supporting Information: Figure 6. Daily maximum and minimum temperatures in the greenhouse experiments carried out under non-controlled and semi-controlled conditions. The mean values were calculated before and during the harvest time period (31stMay). It is also shown the exposition time (hours) to temperatures > 40 C in the non-controlled climatic conditions greenhouse.
A B C D E F Supporting Information: Figure 7. Na+(A, D) and K+contents (B, E), and Na+/K+ratio (C, F), in leaves (A, B, C) and fruits (D, E, F) of non-grafted Moneymaker (MM) cultivar, Jaguar hybrid (F1), and both genotypes grafted on Slcbl10 mutant, when grown at long term in the non-controlled climactic conditions (NCC) greenhouse during spring-summer, with 100 mM NaCl salt treatment. Values are expressed as means SE of three biological replicates made of three plants each. Different letters indicate statistically significant differences among mean values according to Tukey s test (p < 0.05).
Supplementary Table S1. Sequences of primers for RT-qPCR gene expression analysis used in this study. Gene Primer sequence (5'-3') Fw: 5 -GACAGGCGTTCAGGTAAGGA-3 Rv: 5 -GGGTATTCAGCAAAGGTCTC-3 Fw: 5 -TCGAGTGATGATTCTGGTGG-3 Rv: 5 -ATCACAGTGTGGAAAGGCTC-3 Fw: 5 -TGAGCTAGGGAATGTAATAAACG-3 Rv: 5 -AGAGAGAAACTAACGATGAACC-3 Fw: 5 -CTCAAGAGTCACCACCAAGCA-3 Rv: 5 -CCAACCAAAACAAGACCCAACA-3 Fw: 5 -TGGTGGGCAGGTTTGATGAGAG-3 Rv: 5 -TGTGGTGGCAGCAGCAGGAGACTTA-3 Fw: 5 -CCATTATTGCACTCATTGAAGC-3 Rv: 5 -AGCAAGGTCCGTGTATTCGT-3 Fw: 5 -CTATAAGGCTGTTGGCAGCAAA-3 Rv: 5 -TGCCCTGCTCAACCGAAT-3 Fw: 5 --GTATGATGTGACCGTTGTTACG-3 Rv: 5 -TCAGATCCTGTGATGCAAAGG-3 Fw: 5 -TGCCTGCTCGACTCCAAAGA-3 Rv: 5 -TCCGAGTCTGTTCTGAACTTCAAG-3 EF-1 SlSOS1 SlHKT1.2 SlNHX3 SlNHX4 SlCBL10 SlSKOR SlHAK5 SlLKT1