National Malawian Weekly COVID Cases Analysis
Analysis of weekly confirmed COVID cases in Malawi, distribution of Ct values in each wave, comparison between HIV positive, negative, and unknown Ct values, ROC curves for sequencing thresholds, cases by lineage, and catchment area mapping.

Uploaded on Apr 28, 2025 | 0 Views
Download Presentation

Please find below an Image/Link to download the presentation.
The content on the website is provided AS IS for your information and personal use only. It may not be sold, licensed, or shared on other websites without obtaining consent from the author.If you encounter any issues during the download, it is possible that the publisher has removed the file from their server.
You are allowed to download the files provided on this website for personal or commercial use, subject to the condition that they are used lawfully. All files are the property of their respective owners.
The content on the website is provided AS IS for your information and personal use only. It may not be sold, licensed, or shared on other websites without obtaining consent from the author.
E N D
Presentation Transcript
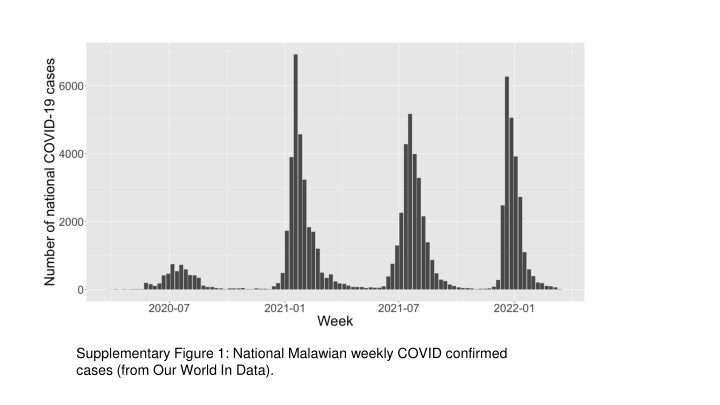
Supplementary Figure 1: National Malawian weekly COVID confirmed cases (from Our World In Data).
Supplementary Figure 2: The distribution of Ct values in each wave. The only significant difference by Kolmogorov-Smirnov test was between wave 2 and wave 4. The P-value is indicated on the graph.
Supplementary Figure 3: The distribution of Ct values between people who were HIV positive, HIV negative, and unknown.
A) B) Ct 27 Ct 28 Supplementary Figure 4: ROC curves for A) UNZA and B) ARTIC showing the true positive rate and false positive rate for Ct thresholds from 15 to 40 for what should be sequenced. The true positive rate was defined as the proportion of samples with a genome coverage >=70% that had a Ct below the threshold, and the false positive rate was defined as the proportion of samples with a genome coverage <70% that had a Ct below the threshold
Supplementary Figure 6: A map of Malawi with our approximate catchment area highlighted in red. Map shapefile obtained from https://mrc-ide.github.io/naomi/.


")