Explore the key findings of the 2023 National Malnutrition Survey conducted by Dr. Erin Stella Sullivan from the Department of Nutritional Sciences at King's College London, including insights on malnutrition risk rates, comparisons to previous surveys, and breakdowns by age, BMI, and disease groups.
Please find below an Image/Link to download the presentation.
The content on the website is provided AS IS for your information and personal use only. It may not be sold, licensed, or shared on other websites without obtaining consent from the author. If you encounter any issues during the download, it is possible that the publisher has removed the file from their server.
You are allowed to download the files provided on this website for personal or commercial use, subject to the condition that they are used lawfully. All files are the property of their respective owners.
The content on the website is provided AS IS for your information and personal use only. It may not be sold, licensed, or shared on other websites without obtaining consent from the author.
E N D
Presentation Transcript
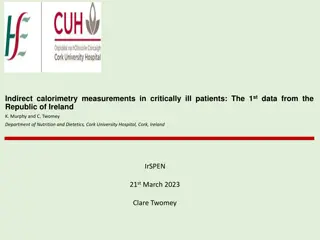
Findings of the 2023 National Malnutrition Survey Dr. Erin Stella Sullivan RD Department of Nutritional Sciences, King s College London
Affiliations & Declaration of Interests Research Funding: Irish Cancer Society Irish Research Council Nualtra Danone Nutricia Research Memberships: IrSPEN Management Committee INDI Cancer Nutrition Network CPD Lead Nutrition Society Parliamentary Advisory Group Honoraria: Complete Nutrition MedMedia British Dietetic Association
Outline Hospital Results Community Nursing Unit Results Frailty & Nutrition Screening Key Findings Individual Report Structure
Screening Characteristics N =3662 (3647 aged 18 years) 26 hospitals included (1 excluded from main report due to sampling difference) 2 with Other scores Mean (SD) BMI was 26.3 (6.7) kg/m2 BMI < 20 kg/m2: 15% BMI 20-24.9 kg/m2: 31% BMI 25 kg/m2: 54%
Risk Compared to Previous Surveys Malnutrition according to risk category Malnutrition according to risk category Category Category NMS 2023 NMS 2023 NSW 2011 NSW 2011 NSW 2010 NSW 2010 Medium Risk Medium Risk 12% 7% 8% High Risk High Risk 22% 20% 25% Medium + High Risk Medium + High Risk 34% 27% 33% Total (n) Total (n) 3267 1102 1610 Russell CA, Elia M. Nutrition Screening Survey In The UK And Republic Of Ireland In 2010 [Internet]. 2010 [cited 2024 Jun 14]. Available from: https://www.bapen.org.uk/pdfs/nsw/nsw10/nsw10-report.pdf ; Russell CA, Elia M. Nutrition Screening Survey In The UK And Republic Of Ireland In 2011 [Internet]. 2011 [cited 2024 Jun 14]. Available from: https://www.bapen.org.uk/pdfs/nsw/nsw-2011-report.pdf
Nutrition Support by Malnutrition Risk Proportion receiving nutrition support: 38% overall High Risk: 74% Medium Risk: 57% Low Risk: 22% 39% of receiving nutrition support were recorded as low risk or not at risk
Characteristics N =251 (249 with malnutrition screening) 9 CNUs included 148 (59%) females (aged median 76 years [IQR: 68-83]) 102 (41%) males (aged median 72 years [IQR: 65-82]) 8% aged <64 years 30% aged 65-79 years 62% aged 80+ years 41% of residents were receiving nutrition support
Overall Malnutrition Risk Rates 238 with MUST scores (24% high or medium risk) 92 with MNA scores (78% at risk or malnourished) 19 with SANSI scores (2% high risk) Malnutrition Risk in patients screened using any screening tool (MUST/SANSI/MNA-SF) Malnourished At Risk Malnourished + At Risk (n = 249) 21% 29% 50% Age category associated with increasing high risk scores
Summary Highly representative survey sample Older age and more cancer, both associated with significantly increased risk of malnutrition Patient nutrition appears better managed within hospitals than at the time of prior surveys Choice of screening tool important Differences between CNUs and Hospitals Frailty screening not associated with malnutrition risk Full references available at the NMS 2023 Report, published online at https://irspen.ie/wp-content/uploads/2024/06/National-Malnutrition-Survey- 2023-IrSPEN-Report.pdf
Thank You Erin Stella Sullivan Department of Nutritional Sciences, King s College London Contact details: +44 (0)20 7848 4509 erin_stella.sullivan@kcl.ac.uk https://www.kcl.ac.uk/people/erin-stella-sullivan @ErinSullivanRD