National Minimum Wage Research Synthesis in South Africa
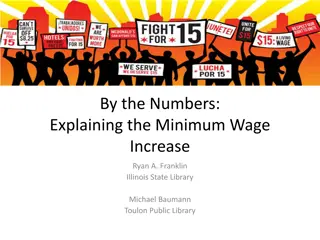
Understanding the impacts of a national minimum wage in South Africa on the economy, employment, and collective bargaining. Explore labor market analysis, poverty lines, and the importance of employment in reducing poverty and inequality.

Download Presentation

Please find below an Image/Link to download the presentation.
The content on the website is provided AS IS for your information and personal use only. It may not be sold, licensed, or shared on other websites without obtaining consent from the author.If you encounter any issues during the download, it is possible that the publisher has removed the file from their server.
You are allowed to download the files provided on this website for personal or commercial use, subject to the condition that they are used lawfully. All files are the property of their respective owners.
The content on the website is provided AS IS for your information and personal use only. It may not be sold, licensed, or shared on other websites without obtaining consent from the author.
E N D
Presentation Transcript
A National Minimum Wage in South Africa Synthesis of relevant research 1 December 2015 1
Introduction i. ii. iii. Minimum wages in South Africa iv. Impact of a NMW on economy, employment & collective bargaining v. Institutional arrangements for a NMW vi. Enforcement and compliance in SA vii. Summary & Conclusions Labour market analysis Poverty lines, working poor and a NMW 2
1. Labour market analysis Main sources: i. A Finn, A National Minimum Wage in the context of the South African Labour Market. NMW Research Initiative, University of Witwatersrand. ii. L Patel, et al. An Assessment of the Impact of a NMW on Young People s Labour Market Outcomes. CSDA, University of Johannesburg. Select focus on wage structure of the SA labour market and young people as a particularly vulnerable group 3
Employment is the key for lower poverty, lower inequality Employment allows escape from poverty Although number of employed has risen by 4 m. since 1994, working age population has risen by 8 million Low levels of employment are reflected in high reliance on social grants for the poor Wage income accounts for 60% of income of lowest 3 income deciles in Brazil, compared to just 40% in South Africa. (ILO GWR) Leibbrandt et al (2010) show that a third of income inequality due to lack of access to employment Source: IES 2010/11, Stats SA, National Treasury calculations Employment and growth are interdependent The NDP estimates that to raise employment to 60%, we would have to grow by 5.4% Patrick Belser (ILO) indicated that minimum wages are no substitute for growth (international workshop) 4
National unemployment rate at 25.5% - Who is most vulnerable? The young 49.9 % of labour force between 15-24 is unemployed Less educated 33% unemployment for those with uncompleted secondary education Those who lack experience long term unemployment rate is 66.3% What about underemployment? 15% of workforce work less than 30 hrs/week Finn s work highlights slight overall downward trend. Sharp decline in domestic work(Average: 34 hrs/wk in 2012 from 40 hrs/wk in 2003). Rural workers far from opportunities, compounded by low skills and experience. SA s unemployment higher than countries that recently considered or introduced a NWM China - approximately 4 % Germany - 6.4 %... the lowest since reunification Mexico - 4.2 % Malaysia 2.9 % 5
Wages as share of income Weak attachment to labour market drives inequality 6
What does the data tell us about wages? Monthly wages of part-time workers is lower than full-time workers Monthly Wage (2015 prices) All workers working less than 30 hours All workers working less than 40 hours Workers working between 40-45 hours Workers working more than 45 hours Mean 6605.21 9134.32 9357.26 5635.28 Median 2269.85 3354.97 4007.33 2533.70 Returns to education is very high Vocational training can double wages for workers with incomplete schooling Distribution is wider for higher levels of education Averages of Top and bottom 5%: Primary: R524 - - R 9086 Middle: R524 - - R13105 Secondary: R524 - - R23298 Tertiary: R746 - - R41937 Young workers earn less due to relative inexperience Of which: Certificate/Diploma less grade 12 Of which: Certificate/Diploma with grade 12 Median Monthly wage (2015 prices) Number of workers Incomplete secondary qualifications Of which: Vocational training Of which: School grade Secondary qualifications 3 412 086 33 963 3 378 123 3 410 188 2446.33 6115.83 2446.33 3727.75 Of which: Vocational training 38 783 6523.55 Of which: Matric Tertiary qualifications 3 371 405 2 388 693 3727.75 10903.66 Of which: Vocational Training 118 998 6248.64 88 769 6523.55 1 176 641 8387.43 Of which: Diploma Of which: University 174 104 830 181 13047.11 15726.43 8
Sectoral wages differ dramatically: Proportion of workers below each wage level 9
Preliminary findings Young Peoples Wages Respondents in focus groups with both employed and unemployed youth were asked to write down the amounts indicated in the first column. Averages are indicated in the second and third columns. Employed respondents (n=51) Unemployed respondents (n=61) Their reservation wage R3187.23 R2885.81 Their idea of what a fair wage would be R7880.85 R8304.03 The amount of money needed to cover the cost of living for a month R4603.10 R5770.81 Current wage (for employed respondents) R2767.49 10
Preliminary findings Young Peoples Wages Respondents were asked to explain how they calculated the lowest amount that you would work for (reservation wage). For employed and unemployed respondents, the cost of living was the overarching consideration. This is evident in the low average reservation wage (R3187 for employed; R2886 for unemployed). There is a large disconnect between reservation wages and wages perceived to be fair. In other words, when thinking about the lowest amount of money they would work for, fairness is not a deciding factor. For employed respondents, fair wages are on average (R7881) more than twice their reservation wages (R3187); for unemployed respondents fair wages are on average (R8304) more than thrice their reservation wages (R2886). Many unemployed and employed respondents indicated that they would accept very low wages if the corresponding job were located close to where they live, thus obviating the need to cover large travel-related expenses. 11
Preliminary findings Young Peoples Wages There is substantial evidence of workers being paid below the minimum wages covering their sectors. For example, several full-time farm workers in rural KZN were paid R700 per month, which is below the sectoral determination of R2606.78 per month. Contract cleaners in Johannesburg were paid R2500 per month, which, assuming an 8-hour day and 22 working days per month (they in fact work 6 8- hour days per week), works out to R14.20 per hour, which is below the sectoral determination of R16.98 per hour. Most respondents, and especially unemployed respondents, are against the idea of a youth sub-minimum wage in South Africa because (a) young people often have the same responsibilities, and therefore same cost of living, of older people (such as care for children and other dependents); and (b) young people work just as hard (and in some cases harder, for example in jobs requiring manual labour). Some employed respondents indicated a fear of their wages being reduced. Interestingly, more employed respondents were in favour of a youth-subminimum than unemployed respondents, with those in favour believing it might make employers more willing to hire them or other young people. 12
Preliminary findings Influence of minimum wages on behaviour Unemployed respondents would mostly be willing to accept a job offer at R2600 per month, the average wage earned by 18-25 year olds earning R50 per hour (approx. R8000 per month)(Stats SA QLFS, Q4 2014). Employed respondents earning more than this amount would not; those earning less would. Many respondents adjusted their reservation wages downwards after seeing the average wage earned by young workers. However this knowledge did not generally change perceptions of what a fair wage would be. Respondents were asked to vote for their preferred minimum wage system. The results are as follows: Type of system Employed respondents (n=51) Unemployed respondents (n=61) National 33.3% 34.0% Sectoral 35.6% 42.86% Hybrid 13.3% 8.93% Youth sub-minimum 20.0% 14.29% 13
2. Poverty lines, working poor and a NMW A. Finn (Wits NMW Research Initiative) Calculation of NMW in relation to wage earners in households working at least 35 hours per week Household poverty gap and average poverty gap per earner in each working poor household Mean wage per earner + average poverty gap per earner = household income per capita at poverty line WORKING POOR LINE OF R4104 PER MONTH 14
2. Poverty lines, working poor and a NMW NMW as wage floor can protect most vulnerable workers effectively from exploitative wages NMW as minimum standard of living may result in employment losses which exacerbates poverty Effects on poverty also depend on social wage : SA spend 35% of government s budget on programmes well-targeted to poor households: free basic education, health care, water and electricity, income support grants for children and the elderly. In SA employment is main determinant of poverty and inequality Finn (2015) - Poverty line of R1314 pc 100 80 46.64 72.54 60 40 53.35 20 27.46 0 No earner in household Earner in household Non-poor Poor Choice of poverty line matters! Finn s poverty line places national poverty rate at 55.6% Official poverty lines much lower Food poverty line = R407 pc pm Lower bound PL = R609 pc pm Upper bound PL = R947 pc pm Very difficult to reconcile impacts on individual workers VS households needs differ! Eyraud and Saget (2005): (t)he Minimum wage is a policy tool to provide an effective backstop at the lower end of the wage distribution.. [but] broader income transfers, unrelated to employment status, are necessary to reach the poorest households. 15
3. Minimum wages in South Africa Bargaining Councils: 38 in private sector 6 in public sector Coverage: approx. 2.2 m Average monthly min. wage: R2731.74 Sectoral Determinations: Contract cleaning, pvt security, domestic, farm workers, etc. Estimated coverage: 4.6m Average monthly min. wage: R2362.36 16
Sectoral Determination minimum wages Lowest minima: Domestic non-metro R1812.57pm R9.30ph R83.70pd Highest: Wholesale & Retail R3866.20pm (Sales person Area A) R19.83ph R178.47pd Average minimum monthly wage: R2703.00 17
Bargaining Council minimum wages Lowest minima: Hairdressing (unskilled), Free State R1192pm R6.11ph R275pw Highest: New Tyre (skilled) R3243pw R12974pm R73.71ph Average minimum monthly wage: R3141.85 18
Known impacts of Minimum Wages : SA evidence A number of studies on sectoral determinations Mostly show negligible impact on employment offset by Change in wage** Non-compliance^ Sector Employment impact # hours Negligible (Negative) * Retail 10% Negative 34% Domestic work (Bhorat et al 2012) Domestic work (Dinkelman & Ranchhod 2012) Negligible (Negative) * 25% - 39% No negative No negative - Negligible (Negative) * Forestry 18% - 53% Negligible (Positive) * Taxi industry 35% Negative 47% Neglibile (Positive)* Private security 20% Negative 67% Large negative ^^ Agriculture 43% Negative 55% * Bhorat et al (2013); ** Bhorat et al (2008); ^ Bhorat et al (2012a); ^^ Bhorat et al (2014) Rises as wages increase Lower employment of vulnerable Part time Seasonal (Conradie 2004 grape pickers) Low skilled (Murray & van Walbeek 2007 sugar farms) 19
The wage distribution of those in formal employment 15% of the workforce earn less than R1258/month 25% of the workforce earn less than the R1886/month 47% of the workforce earn less than the R3189/month 30 57% of the workforce earn less than R4303/month 20 1 in 4 workers earns less than R1 886 per month Percent 10 0 0 10000 20000 30000 40000 50000 Monthly Wage (2015 prices) Source: Labour Market Dynamics Survey 2014, excludes informal workforce and those earning more than R50 000 per month 20
4. Impacts of a NMW i. Sources: ADRS (Wits NMW Research Initiative) & National Treasury Modelling approaches iii. Scenarios iv. Impact on wages and existing bargaining council agreements v. Economic impacts ii. 21
Basic description: Modelling approaches ADRS NT DPRU Modelling technique Non-linear long run co- integration model Computable General Equilibrium (CGE) Advantages - Reflects long run structure of economy - Detailed causal reasoning for transmission - Snapshot - Clear decision making criteria - Detailed transmission through sectors Disadvantages Past relationships don t capture changes in decision making High structural unemployment limits direction of employment impact How does it solve? Modeller reruns until system stabilises Model reruns until it finds point of stability Trade offs? Open ended results in high level of tolerance for wage increases Yes results on low level of tolerance for wage increases (in line with lit) Poverty and Inequality analysis? No No augment with micro incidence analysi sof workers (not households) Time progression Yes No Augment with long run model and macro model for inflation 22
Overview of scenarios tested ADRS: R6000 p.m. (Adjustment: Inflation +2) xx% of workforce (65% of full time) Lower: R3236-R3698 p.m. (70-80% of MW) xx% of workforce ADRS: R4623 p.m. 45% of mean, step up to 50% Lower: R3236-R3698 p.m. (70-80% of MW) NT: R4303 p.m. No further exclusions.* 57% of workforce LEVEL ADRS: R3467 p.m. 40% of mean, step up to 45% xx% of workforce Lower: R2080-R2774 p.m. (60-80% of MW) NT: R3189 p.m. No further exclusions.* 47% of workforce ADRS: R2250 p.m. No further exclusions (Adjustment: Inflation) xx% of workforce NT: R1886 p.m. No further exclusions.* 25% of workforce 15% of workforce NT: R1258 p.m. No further exclusions.* COVERAGE ADRS exclude part-time work NT Lower rates for Agri, EPWP, domestic Common exclusion: Self- employed exclude Informal sector 23 * NT sensitivity tests on exclusions
What happens to wages? ADRS wage adjustment lower due to lower coverage NMW scenarios' impact on average (real) wage 100.00 90.00 80.00 70.00 60.00 50.00 40.00 30.00 20.00 10.00 0.00 24
NT Coverage: A profile of those earning below tested thresholds Monthly Minimum Wage (2015 prices) % of workforce earning below: R 1 258 21% R 1 886 45% R 3 189 73% R 4 303 82% Total 936 905 Primary educated labour Low skilled workers earn the least Incomplete secondary education or technical equivalent educated labour Completed secondary education or technical equivalent labour Tertiary educated or technical equivalent labour 17% 34% 64% 75% 2 630 055 13% 22% 43% 55% 2 906 111 8% 12% 21% 27% 2 155 753 Proportion of workers under proposed NMWs (2015 prices) Agriculture Mining R 1 258 R 1 886 R 3 189 R 4 303 Total High wage adjustments in agri 17% 8% 43% 12% 86% 22% 91% 31% 540 954 352 211 Manufacturing Utilities Construction 14% 8% 12% 23% 13% 28% 42% 25% 54% 54% 36% 68% 1 324 323 96 284 686 689 Wholesale and retail trade Transport Financial services 12% 16% 35% 23% 23% 38% 52% 38% 44% 66% 49% 53% 1 758 021 578 535 326 455 High proportion of workers affected in service sectors; large numbers too Business services 17% 28% 55% 65% 1 094 810 Community services 14% 24% 36% 43% 2 675 172 25 Private households 26% 52% 84% 92% 1 170 486
Number of workers affected by sector Proportion of workers under proposed NMWs (2015 prices) R 1 258 R 1 886 R 3 189 R 4 303 Total Agriculture 17% 43% 86% 91% 540 954 Mining 8% 12% 22% 31% 352 211 Manufacturing 14% 23% 42% 54% 1 324 323 Utilities 8% 13% 25% 36% 96 284 Construction 12% 28% 54% 68% 686 689 Wholesale and retail trade 12% 23% 52% 66% 1 758 021 Transport 16% 23% 38% 49% 578 535 Financial services 35% 38% 44% 53% 326 455 Business services 17% 28% 55% 65% 1 094 810 Community services 14% 24% 36% 43% 2 675 172 Private households 26% 52% 84% 92% 1 170 486 Source: Labour Market Dynamics Survey 2014; NT calculations Excludes informal workers 26
Shocks in average wage Impact on average wages (2015 prices) R 1 258 R 1 886 R 3 189 R 4 303 Includes average 11.7% jump in average wages for primary and middle skilled in Manufacture of non- metallic mineral products if NMW is R1 886 Agriculture 3.7% 12.3% 54.6% 98.0% Mining 0.9% 1.8% 4.9% 9.0% Manufacturing 2.3% 5.3% 16.2% 28.6% Includes a 28.7% jump in average wages for primary skilled in Construction if NMW is R3 189 Utilities 2.1% 3.1% 7.3% 11.4% Construction 1.3% 4.9% 17.9% 33.0% Includes an average 22.8% jump in average wages for middle and secondary skilled in Retail Trade if NMW is R4 303 Wholesale and retail trade 1.3% 3.5% 13.2% 25.3% Transport 1.6% 3.6% 10.1% 17.9% Financial services 0.6% 1.3% 3.7% 7.0% Business services 1.5% 4.0% 15.4% 29.0% Includes a 21.4% jump in average wages for middle skilled in Other Business Activities (Labour Brokers) if NMW is R3 189 Community services 3.4% 11.0% 35.5% 59.4% Private households 5.2% 15.4% 51.5% 90.0% Source: Labour Market Dynamics Survey 2014. National Treasury own calculations. Excludes informal workers 27
Impact of different NMWs on collective bargaining Wage level Collective Agreements affected Bargaining Councils Textile (carpets), Hairdressing (FS & Kim.) R1258 2 Furniture, Hairdressing, Textile R1886 3 Restaurant, Fishing Meat, Building, Laundry, Contract Cleaning, Furniture, Hairdressing, Textile, Clothing R3189 19 Restaurant, Fishing Meat, Building, Laundry, Contract Cleaning, Furniture, Hairdressing, Textile, Motor, Electrical, Clothing R4303 21 28
Minimum wages & Collective bargaining ILO: There is a risk that complex systems of minimum wages can become substitute for collective bargaining (eg Philippines). Minimum wages should be targeted at the lowest-paid employees. Collective bargaining zone MW zone 29
Summary: NMW impact modelling Disagreement about direction of impact, modelling methodologies employed. ADRS research NT research DPRU research Input shared with Nedlac by Labour and Community Finds positive GDP impact, except in primary sector Positive effects for incomes Lower employment growth, except manufacturing Increase unemployment rates Inflation slows as NMW increases Increased debt:GDP As part of work of Government Finds negative GDP impact, except mining Lower consumption and investment Negative employment effects, particularly for low- skilled workers Higher inflation Increased debt:GDP Long-run effects stronger Small decrease in inequality (high income groups lose more than low income groups) Commissioned through ECC Expected early December 30
ADRS finds accelerated output growth, slower employment growth relative to baseline Manufacturing sector booms, primary sector under pressure Services employment growth also under pressure Slow, slight increase in unemployment 31
NT finds negative impact on GDP, and employment In the short run (1 2 years) Monthly minimum wage (2015 prices) R1 258 R1 886 -0.3 -0.7 -0.2 -0.6 -0.2 -0.6 -0.3 -0.6 -0.2 -0.6 -0.2 -0.5 -0.8 -2.1 % from no policy policy change R3 189 -2.1 -2.1 -2.0 -1.7 -1.7 -1.6 -6.2 R4 303 -3.7 -3.7 -3.6 -2.9 -3.1 -2.9 -10.1 Real GDP Household consumption Gross fixed capital investment Government consumption Exports Imports Employment Mining only sector with positive production growth high wages & capital intensity shields impact, attracts investment 96 000 lost jobs 244 000 lost jobs 715 000 lost jobs National Minimum Wage R 1 258 R 1 886 -1.5 -4.2 -1.1 -2.9 -0.7 -1.7 0.0 0.0 1 168 000 lost jobs Low skills bear brunt of loss % deviation from base Primary-educated labour Middle-educated labour Secondary-educated labour Tertiary-educated labour R 3 189 -11.9 -8.5 -5.1 0.0 R 4 303 -18.3 -14.0 -8.8 0.0 32 Source: Labour Market Dynamics Survey 2014. National Treasury own calculations.
Potential impacts of a NMW: Global evidence Most of evidence focuses on GDP and employment Globally, negligible negative employment effect from the minimum wage Important caveats for how we analyse the evidence EFFECT CAUSE Magnitude increase in wage bill State of economy Structure of economy Lower unemployment reduces impact For every 1 per cent increase in unemployment rates above pre-recession averages, minimum wage impact decreases employment by 0.05 per cent (Addison et al 2013) Non-wage factors When Brazil real minimum wages almost doubled between 2002 and 2012, commodity prices rose doubled, credit as share of GDP doubled to 49%, and global growth averaged 4.04 per cent. Level of minimum wage relative to median wages Higher levels of MWs lead to employment losses (Centeno et al 2014) In France, 1990 1998 the MW increased from 59 to 62% of median wages. For each 1% increase led to employment losses of 1.67% for men and 1.29 for women. Compared to weak positive effects of 0.26 and 0.15 in the USA where minimum wages rose to 36% of median wages between 1980 - 1991.(Abowdet al 2000) Level of compliance Le Roux et al (2013) find in UK that 1% increase in minimum wage to median wage results in 4.5-6.5% increase in non- compliance rates Wage vs profit driven growth ILO, G20 (2015) show SA is driven by profits rather than wages like Mexico, India and China. Wage driven economies include Germany, France and UK. Affected by factors such as relative importance of imports, propensity to save Share of distribution The larger the share of low income workers, the greater the impact (Rani et al 2013) Heavily influenced by level of unemployment SA level consistently ranked top of emerging markets. 33
5. Institutional arrangements for a NMW First NMW usually political announcement parliament / cabinet / executive Representative Independent Technical committee usually recommendations level to political oversight bolsters legitimacy and social buy-in Most countries do broad consultation of all affected parties (1-2 years) Who? First level approached with caution UK: Started with low level, increased over time as impact became known Germany: Freeze first 2 years, collective agreements supersede NMW Malaysia: Enforcement started a year after implementation, first year for hand holding What? Recommendation guided by set factors, including wage growth, prevailing economic conditions, employment impact, cost of living increases. Secretariat support to review body common particularly to gather information, help with consultation and perform research Strong focus on monitoring of impacts and evaluation of NMW in UK, Germany, Malaysia. How? 34
6. Enforcement and compliance (DPRU) A key consideration for minimum wage legislation ECC oversees Sectoral Determinations DOL responsible for enforcement through Inspection & Enforcement Service (IES) and BC s responsible for enforcement of agreements by agents 45% of covered workers paid below the legislated minimum in 2007 (DPRU) Probability of inspection low Resource constraints on IES and BCs 35
A review of some international literature A Review of the Literature: In the US, the BLS (2009) used the U.S. Current Population Survey and found that about 1.9 million workers or 2.6% of all hourly-paid workers - were paid below the hourly minimum rate. In Indonesia, Rama (2001) used 1993 household data for Indonesia and found that 15% of all full-time urban employees, and 45% of women, earned less than the minimum wage. In Brazil, Lemos (2005) used the Monthly Employment Survey (PME) to estimate that in 2000 the proportion of workers earning below the minimum wage was 13.7% in the private sector and 4.6% in the public sector. In Trinidad and Tobago, Strobi and Walsh (2003) used the Continuous Sample Survey of Population (CSSP) and found that 6 months after the first-time introduction of the minimum wage in 1998, non-compliance was 33%. 36
Estimated rate of compliance with minimum wage legislation in selected developing economies (ILO) mid 2000s late 2000s 100 90 80 70 Rate of compliance 60 50 40 30 20 10 0 Viet Nam Mexico Costa Rica Brazil Peru South Africa Mali Turkey India Indonesia Philippine 37
Compliance and Enforcement Compliance depends on: Awareness of employers and employees The level of the minimum wage Probability of labour inspections and level of sanctions The level of excess labour supply / unemployment The role of social partners Key challenges: The informal economy Limited capacity of labour administration/inspection Limited union coverage Lack civil society organizations 38
Summary & Conclusion Substantial evidence relating to features of SA labour market and vulnerability, less evidence focussed on minimum wages and specific sectors & groups (women, race, age). Substantial international research, but limited research in SA on NMW and likely impact. Different findings relating to economic impact of NMW, but generally negative employment effects. Significant gap between perceived fair wage and working poor wage on one hand and actual earned wages and negotiated wages, on the other hand. Compliance poses a risk as does current enforcement capacity 39
Thank you Ngiyathokoza Ke a leboha Ke a leboga Siyabonga Ndo livhuwa Enkosi Ngiyabonga Dankie 40


")