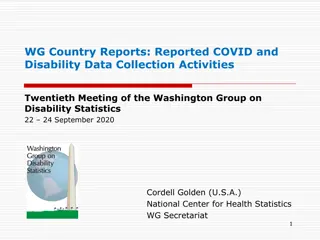
National WinS Data Collection and Analysis in [Insert Country]
This presentation sheds light on the availability, collection, analysis, reporting, and challenges of WinS data in [Insert Country]. It discusses the elements for which national data is available, the sources and frequency of data collection, entities responsible for data analysis, and successful monitoring examples. Additionally, it explores monitoring challenges faced by the country in the WinS sector.
Download Presentation

Please find below an Image/Link to download the presentation.
The content on the website is provided AS IS for your information and personal use only. It may not be sold, licensed, or shared on other websites without obtaining consent from the author.If you encounter any issues during the download, it is possible that the publisher has removed the file from their server.
You are allowed to download the files provided on this website for personal or commercial use, subject to the condition that they are used lawfully. All files are the property of their respective owners.
The content on the website is provided AS IS for your information and personal use only. It may not be sold, licensed, or shared on other websites without obtaining consent from the author.
E N D
Presentation Transcript
Please use this template/worksheet to prepare a brief (4 min max) presentation on the following information: What national WinS data are available in your country? How does your country collect WinS data? How does your country analyse WinS data? How does your country report and use WinS data? What is an example of a WinS monitoring success in your country? What is an example of a WinS monitoring challenge in your country? Please note: the JMP would like to share your presentation slides on the JMP website ILE page if you agree
WASH in schools data in [Insert Country] Country presentation at the WinS ILE 2022 JMP side session 20 September 2022
[Insert an X directly into the table below based on what national WinS data are available in your country] What national WinS data are available in your country? National data are available on the following elements of WinS: Basic Sanitation Basic Hygiene Basic Water MHH Disabilities Other* *Other (if applicable) = Disaggregated data are available for the following settings: Pre- National Urban Rural Primary Secondary Other* primary *Other (if applicable) =
[Insert an X directly into the table below based on what national WinS data are available in your country] How does your country collect WinS data? National data on WinS are collected through the following sources: EMIS Survey Other* *Other (if applicable) = Data are collected with the following frequency: One-time survey Every few years Annually Other* *Other (if applicable) =
[Insert an X directly into the table below based on what national WinS data are available in your country] How does your country analyse WinS data? National data on WinS are analysed by: Ministry of Education Non-profit Organization Other* *Other (if applicable) = Data are analysed using: Excel STATA SPSS Other* *Other (if applicable) =
[Insert an X directly into the table below based on what national WinS data are available in your country] How does your country report and use WinS data? WinS data are reported via: If available, please provide URL (web) links to publicly available reports and dataset here: Public website** Locked website Annual reports** Other* *Other (if applicable) = **URL (web) links to publicly available reports and datasets: WinS data are available to: School Government officials Everyone Other* administrators *Other (if applicable) =
[Please highlight an example of a WinS monitoring success in your country to share with other countries. You can focus on data collection, analysis, or reporting and use.] Example of WinS Monitoring Success
[Please highlight an example of a WinS monitoring challenge in your country to share with other countries. You can focus on data collection, analysis, or reporting and use.] Example of WinS Monitoring Challenge
Extra slides These are optional and will be removed before posting slides on the JMP website
[Insert data directly into the table below or insert a completed table from tab W1-2 in the Excel file. Including regional disaggregation (as in the Excel file) is optional.] Table W1-2: Basic drinking water services at schools Percent distribution of schools according to main source of drinking water and percentage of schools with basic drinking water services, Survey name, Year Main source of drinking water Improved sources Unimproved sources Percentage with an improved source of drinking water Percentage with basic water services1 Tanker truck or cartA Unpro- tected well / spring Percentage with water availableB Piped water Protected well / spring Rainwater Bottled waterA Surface water No water source Other Total Total 100.0 Area Urban Rural 100.0 100.0 School level Pre-primary Primary Secondary 100.0 100.0 100.0 1 SDG indicator (Targets 4.a and 6.1) - Basic drinking water services in schools refers to water available at the school from an improved source A Delivered and packaged water considered improved sources of drinking water based on new SDG definition. B Water availability is based on the day of the survey/questionnaire and refers to water that is available on premises either from the main source directly or stored. The values in columns B through L should sum to 100.0 Schools are considered to have an improved source of drinking water if W1 = piped, protected well/spring, rainwater, packaged bottled water, or tanker-truck or cart Schools are considered to have water available if W2 = yes Schools have a basic drinking water service if both W1 = an improved source and W2 = yes Denominators are the total number of schools in each disaggregation (total, area, school level, region)
[Insert data directly into the table below or insert a completed table from tab S1-3 in the Excel file. Including regional disaggregation (as in the Excel file) is optional.] Table S1-3: Basic sanitation services at schools Percent distribution of schools according to main type of toilet facilities for students and percentage of schools with basic sanitation services, Survey name, Year Main type of toilet facilities for students Improved sanitation facility Percentage with improved and usable toilets / latrines Percentage with improved and single- sex toilets / latrines Unimproved sanitation facility Pit latrines without slab latrines Percentage with usableA toilets / latrines Percentage with single- sexB toilets / latrines Percentage with basic sanitation services1 Flush/Po ur flush toilets Pit Compos- ting toilets No toilets or latrines latrines with slab Hanging Bucket latrines Other Total Total 100.0 Area Urban Rural 100.0 100.0 School level Pre-primary Primary Secondary 100.0 100.0 100.0 1 SDG indicator (Targets 4.a and 6.2) - Basic sanitation services in schools refers to improved toilets that are usable and single-sex A Toilets are considered usable if they are available to students (doors are unlocked or a key is available at all times), functional (the toilet is not broken, the toilet hole is not blocked, and water is available for flush / pour-flush toilets), and private (there are closable doors that lock from the inside and no large gaps in the structure). B Single-sex toilets refer to separate girls' and boys' toilets or toilets at a single-sex school. Depending on the local context, gender neutral toilets may be appropriate and are considered single-sex if in a private room that allows boys and girls to use the toilet separately. The values in columns B through K should sum to 100.0 Improved sanitation facilities are S1 = flush/pour-flush toilets, pit latrines with slab, and composting toilets Schools are considered to have usable toilets if S2 1 Schools are considered to have single-sex toilets if S3 = yes Schools have a basic sanitation service if S1 = an improved type, S2 = 1, and S3 = yes Denominators are the total number of schools in each disaggregation (total, area, school level, region)
[Insert data directly into the table below or insert a completed table from tab H1-2 in the Excel file. Including regional disaggregation (as in the Excel file) is optional.] Table H1-2: Basic hygiene services at schools Percent distribution of schools according to the presence of handwashing facilities and percentage of schools with basic hygiene services, Survey name, Year Handwashing facilitiesA at the school With no water or soapB soap water With water but no With soap but no With water and soap No handwashing facilities Percentage with basic hygiene services1 Total Total 100.0 Area Urban Rural 100.0 100.0 School level Pre-primary Primary Secondary 100.0 100.0 100.0 1 SDG indicator (Targets 4.a and 6.2) - Basic hygiene services in schools refers to handwashing facilities with water and soap available A Handwashing facilities are any device or infrastructure that enables students to wash their hands using running water, such as a sink with tap, water tank with tap, bucket with tap, tippy tap, or similar device. A shared bucket used for dipping hands is not considered an effective handwashing facility. B Soap includes bar soap, liquid soap and soapy water; it does not include ash or alcohol-based hand rub. Values in columns B through G should sum to 100.0 Schools are considered to have handwashing facilities if H1 = yes Schools are considered to have water for handwashing if H2 = yes, water and soap OR water only Schools are considered to have soap for handwashing if H2 = yes, water and soap OR soap only Schools have a basic hygiene service if H1 = yes and H2 = yes, water and soap Denominators are the total number of schools in each disaggregation (total, area, school level, region)
[Insert data directly into the table below or insert a completed table from tab MHH in the Excel file. Including regional disaggregation (as in the Excel file) is optional.] Table XMHH: Menstrual hygiene management services at schools Percent distribution of schools with water and soap in a private space, disposal bins in girls' toilets, mechanisms for hygiene waste management, and provisions for menstrual hygiene management by type, Survey name, Year Covered bins in girls' toilets for disposal of menstrual materials waste at the school Disposal mechanisms for menstrual hygiene Proportion of schools with provisions for menstrual hygiene management (MHM) by type of provision MHM materials (e.g. pads) education Percentage of schools with all three provisions for menstrual hygiene management (MHM) Percentage with water and soap in a private place, bins, and disposal mechanisms Water and soap available in a private space N/A, no provision s for MHM Water and soap Water, but not soap No water No private spaceA Bathing areas MHM Yes No Yes No Total Area Urban Rural School levelB Primary Secondary A Spaces can include toilets/latrines and do not need to be specifically designated for menstrual hygiene management. B Menstrual hygiene services are not applicable in pre-primary schools. Indicators can be adapted based on national priorities and emerging recommendations for monitoring menstrual health and hygiene for adolescents (i.e. tab 'Global MHH Monitoring Group' in this Excel file. These indicators are not applicable to pre-primary schools Schools with water and soap available in a private space are from question XS1 Schools with covered bins for disposal of menstrual hygiene materials are from question XS2 Schools with disposal mechanisms for menstrual hygiene waste are from question XS3 Schools with basic sanitation are determined in tab S1-3 Schools with provisions for menstrual hygiene management by type are from question XS3 Denominators are the total number of schools in each disaggregation (total, area, school level, region) excluding schools that only offer pre primary level
[Insert data directly into the table below or insert a completed table from tab DIS in the Excel file. Including regional disaggregation (as in the Excel file) is optional.] Table XDIS: Disability inclusive drinking water, sanitation and hygiene services at schools Percent distribution of schools with drinking water, sanitation, and hygiene services accessible to students with limited mobility or vision, Survey name, Year Drinking water Sanitation Hygiene Handwashing facilities accessible to students with limited mobility or visionC Source accessible to students with limited mobility or visionA Toilet accessible to students with limited mobility or visionB Any source Any toilet Any toilet Total Area Urban Rural School level Pre-primary Primary Secondary A The national definition for disability accessible drinking water facilities in schools is XX. B The national definition for disability accessible toilets in schools is XX. C The national definition for disability accessible handwashing facilities in schools is XX. Schools have any water source if W1 is not 'no water source' Schools have water accessible to students with limited mobility or vision if XW3 = yes Schools have any toilet if S1 is not 'no toilets or latrines' Schools have toilets accessible to students with limited mobility or vision if XS7 = yes Schools have any handwashing facilities if H1 = yes Schools have handwashing facilities accessible to students with limited mobility or vision if XH1 = yes Denominators are the total number of schools in each disaggregation (total, area, school level, region)
![National WinS Data Collection and Analysis in [Insert Country]](https://cdn1.slideorbit.com/234463/please-use-this-template-worksheet-to-prepare-n.jpg)



![The Exciting World of Live Music Through [Insert Town/City] Census!](/thumb/148894/the-exciting-world-of-live-music-through-insert-town-city-census.jpg)
